Create transients from pump shutdown events
Create transients from pump shutdown events using the Pump Speed Change option.
Tutorial resources
These downloadable resources will be used to complete this tutorial:
Step-by-step guide
InfoSurge Pro allows hydraulic transients to be created by providing a curve that alters pump and valve operations, as well as junction demand changes. Then, the simulation results from different operational conditions can be compared. In this example, transients are created from pump shutdown events using the Pump Speed Change option.
- Double-click the desired project .aprx file to open ArcGIS Pro.
- Once the project starts, click the InfoWater Pro tab to open the InfoWater Pro ribbon.
- In the Project panel, click Initialize.
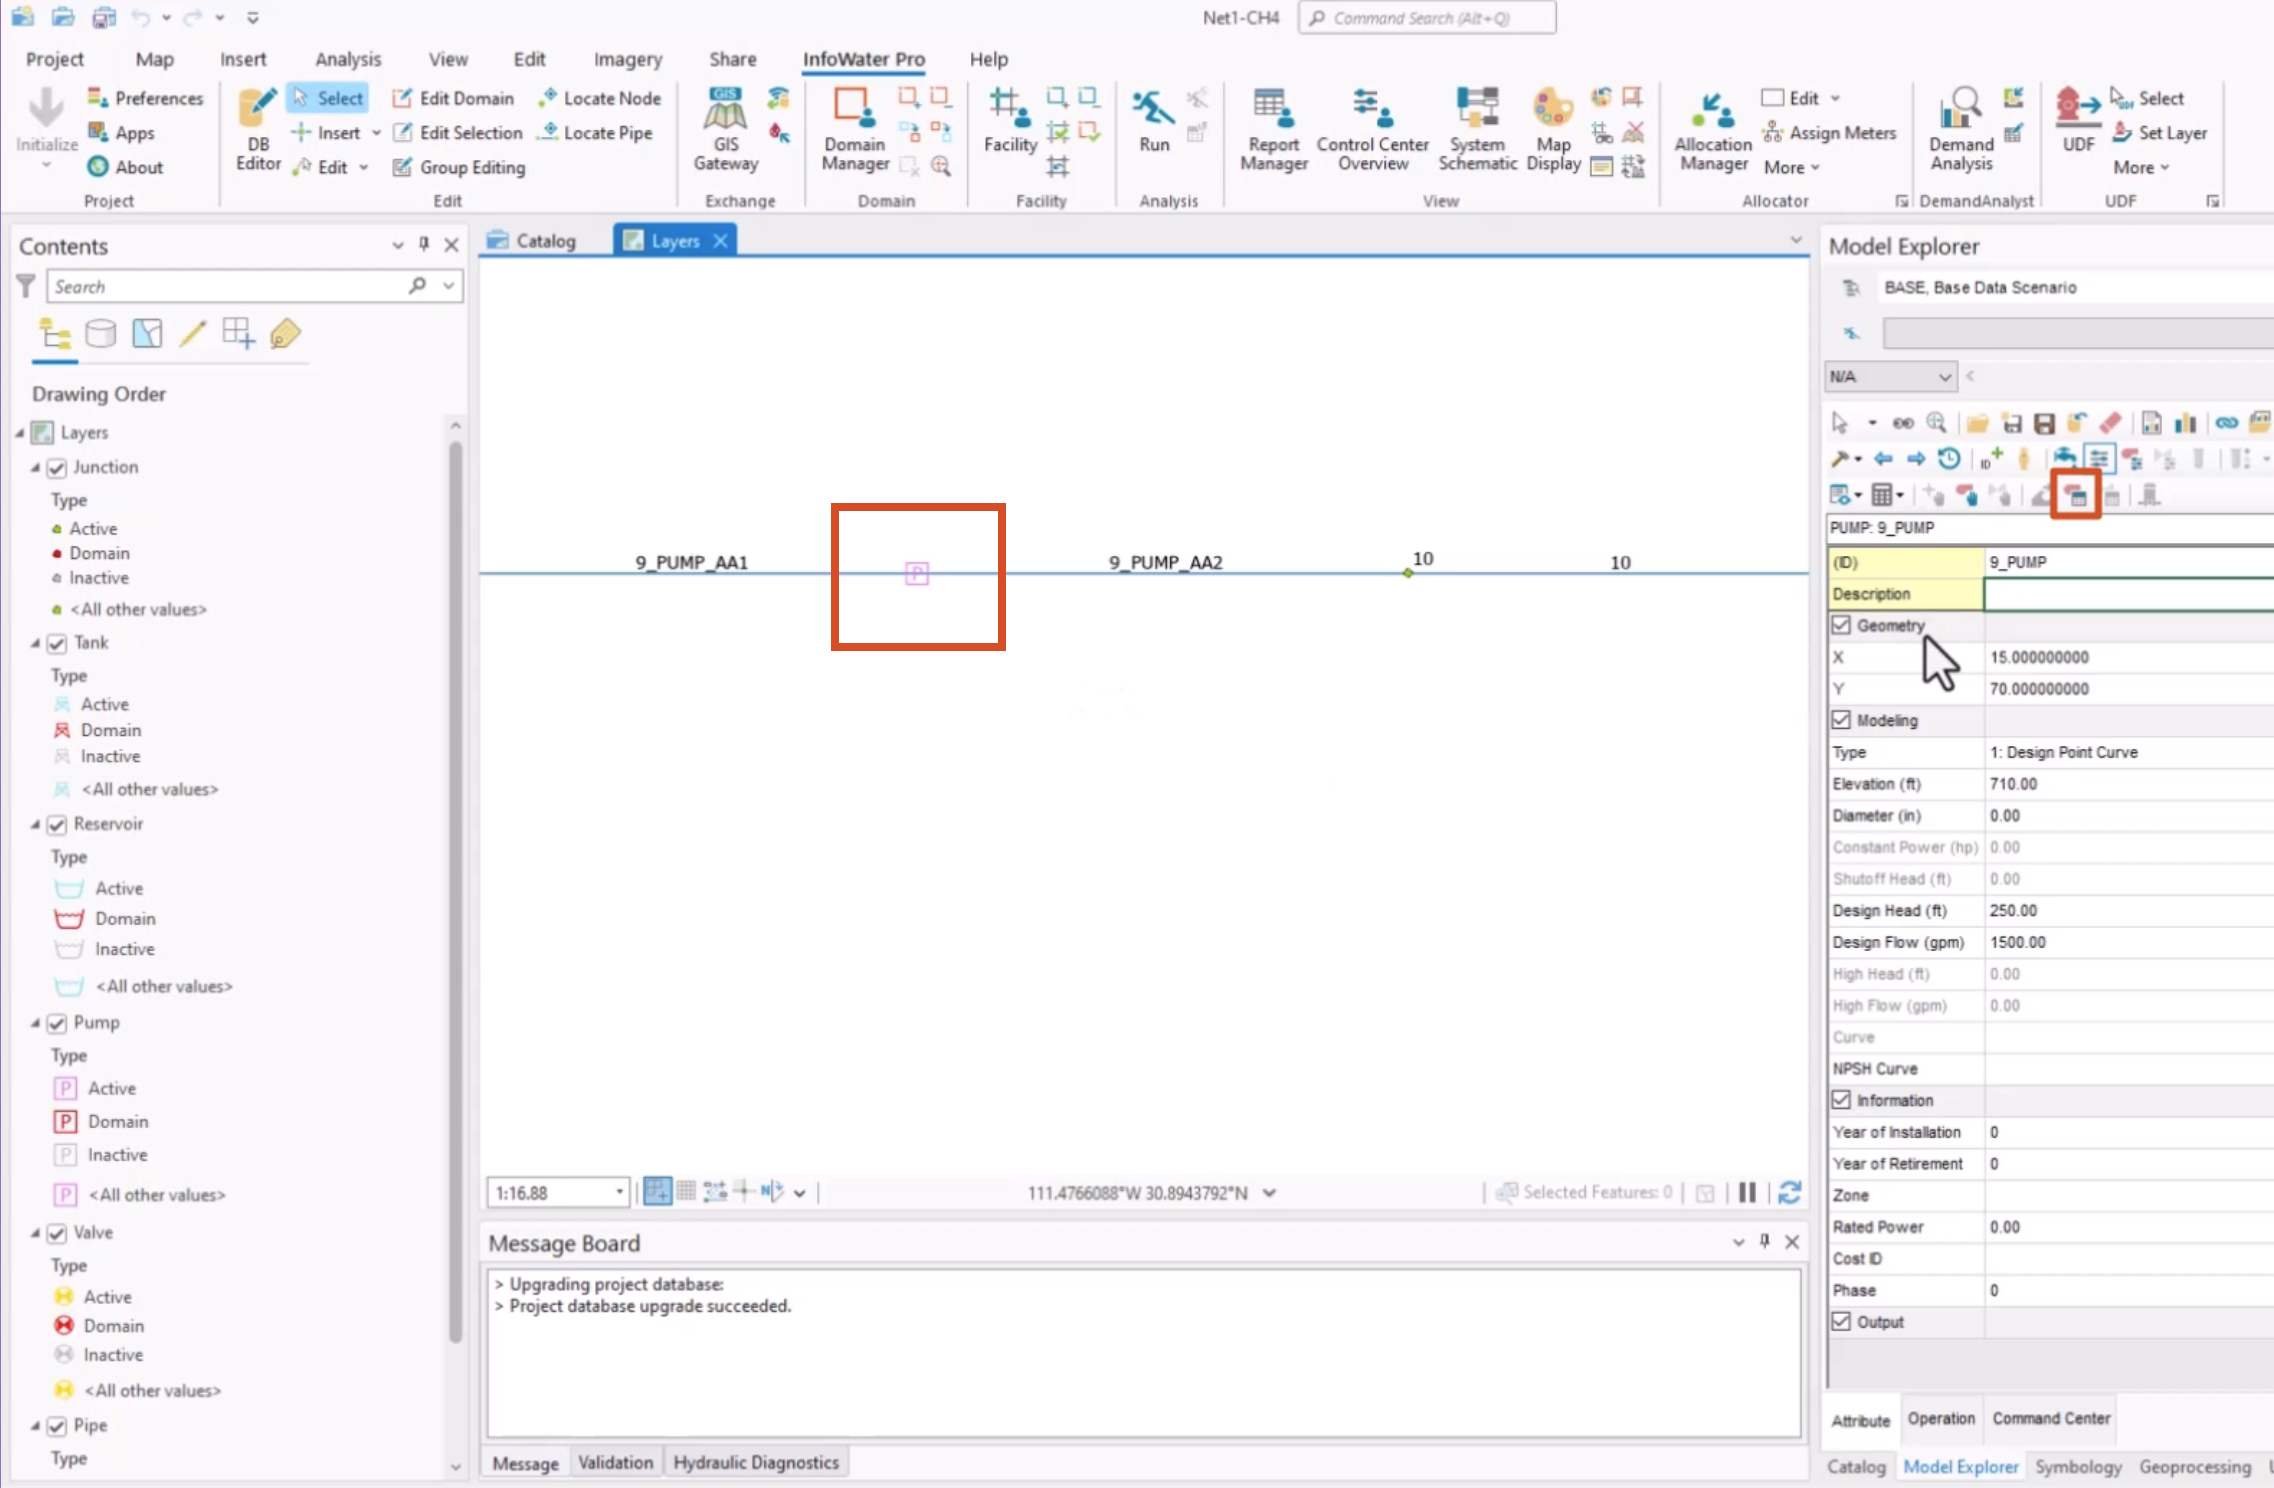
- Activate the Select tool.
- Zoom to and select the desired pump, such as pump ID 9_PUMP.
- From the Model Explorer toolbar, click Pump Surge Data.
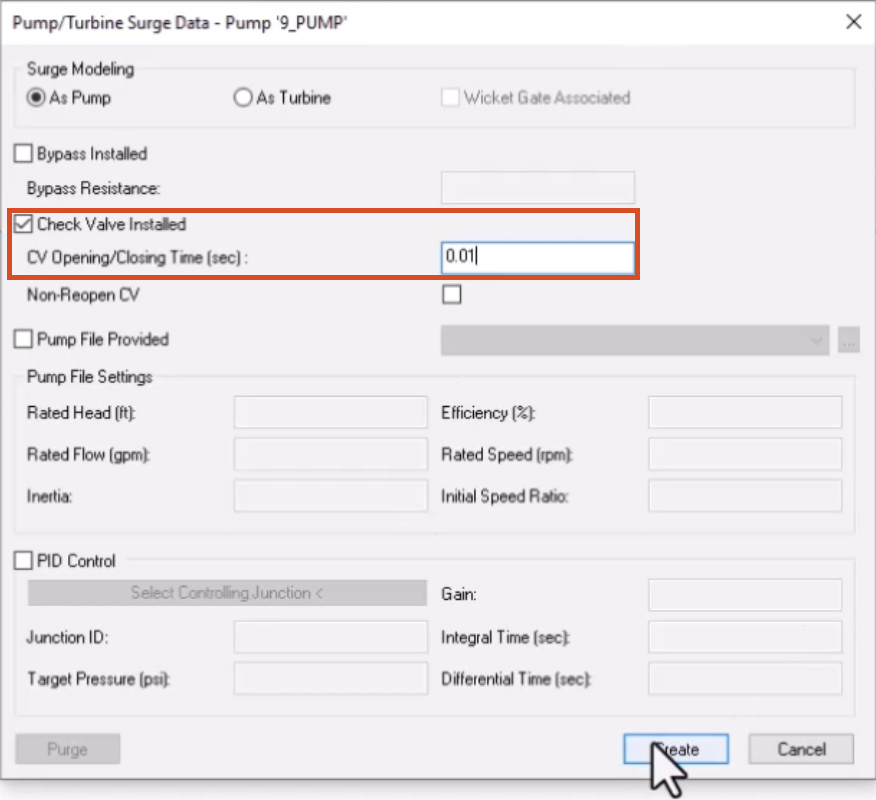
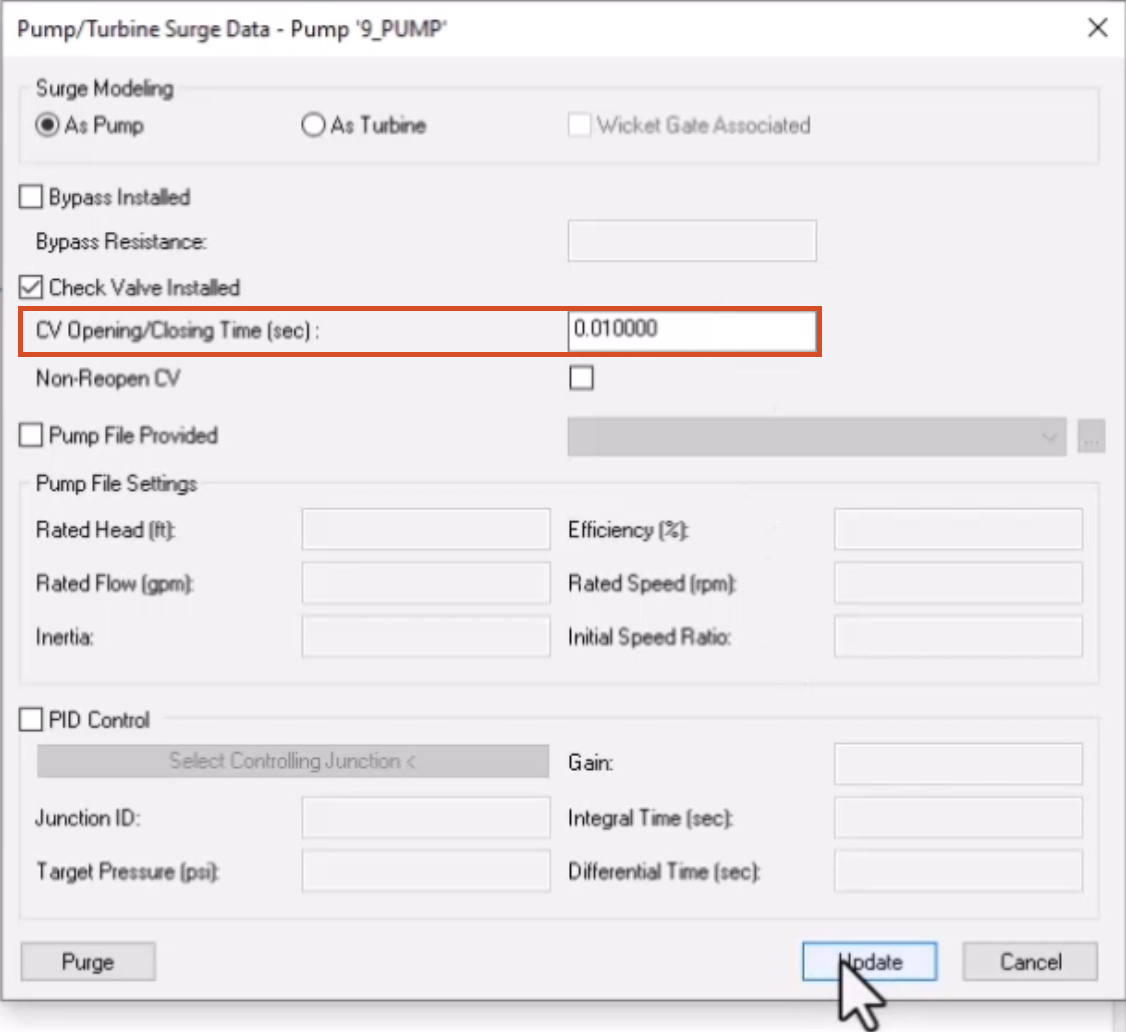
The Pump Surge Data dialog box is used to specify how the selected pump is modeled. To prevent flow reversal through the pump:
- Enable the Check Valve Installed option.
- Enter a Check Valve (CV) Opening/Closing Time of 0.01 seconds.
- Click Create to save the settings and close the dialog box.
Changes in pump operating speeds produce transients. Time-dependent speed ratios can be applied to pumps as a speed curve.
- From the Model Explorer toolbar, click Pump Operation Change.
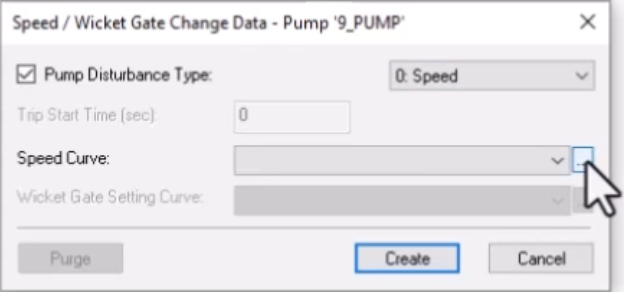
- In the Pump Operation Change dialog box, select the Pump Disturbance Type option.
- Expand the Pump Disturbance drop-down and set the disturbance speed to “0: Speed”.
The selected curve dictates the pump speed over time.
- Next to the Speed Curve drop-down, click Browse (...) to open the Curve dialog box.
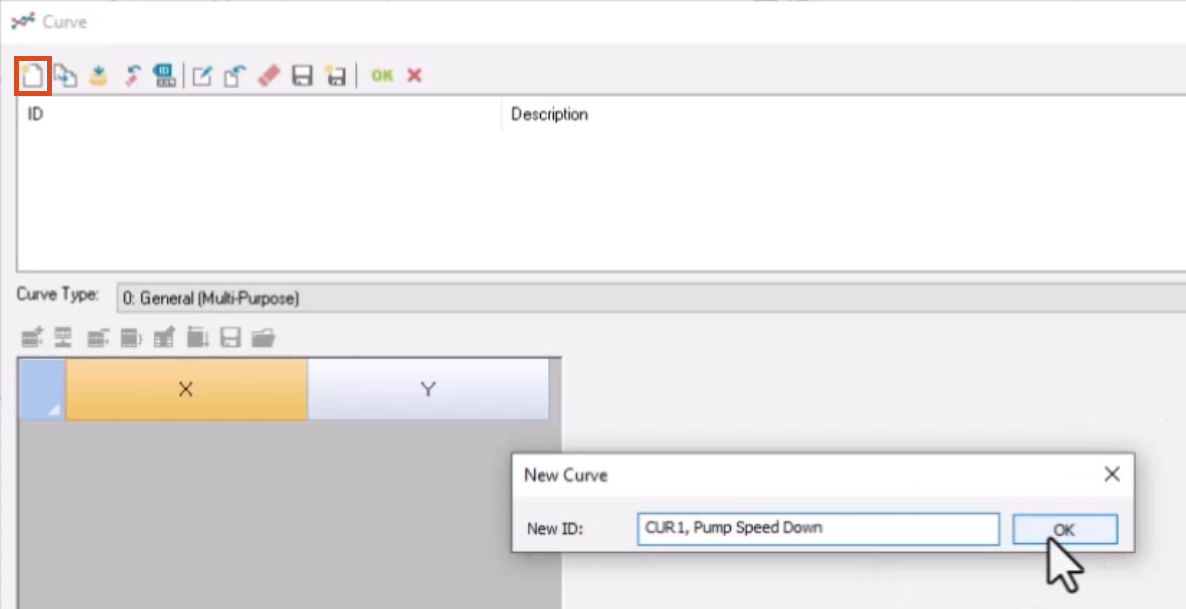
The model does not currently have a speed curve to use, so one must be created. To create the speed curve:
- Click New.
- In the New Curve dialog box, for this example, enter the name “CUR 1, Pump Speed Down”.
- Click OK.
- In the Curve dialog box, click the Set Rows button.
- In the Curve popup, Value field, enter “3”.
- Click OK.
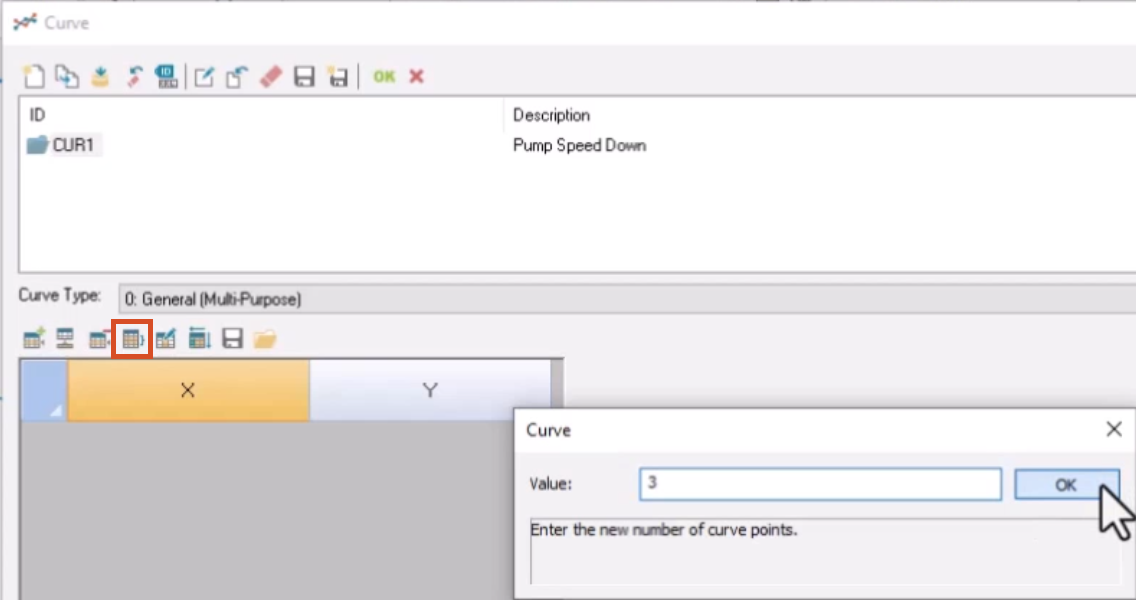
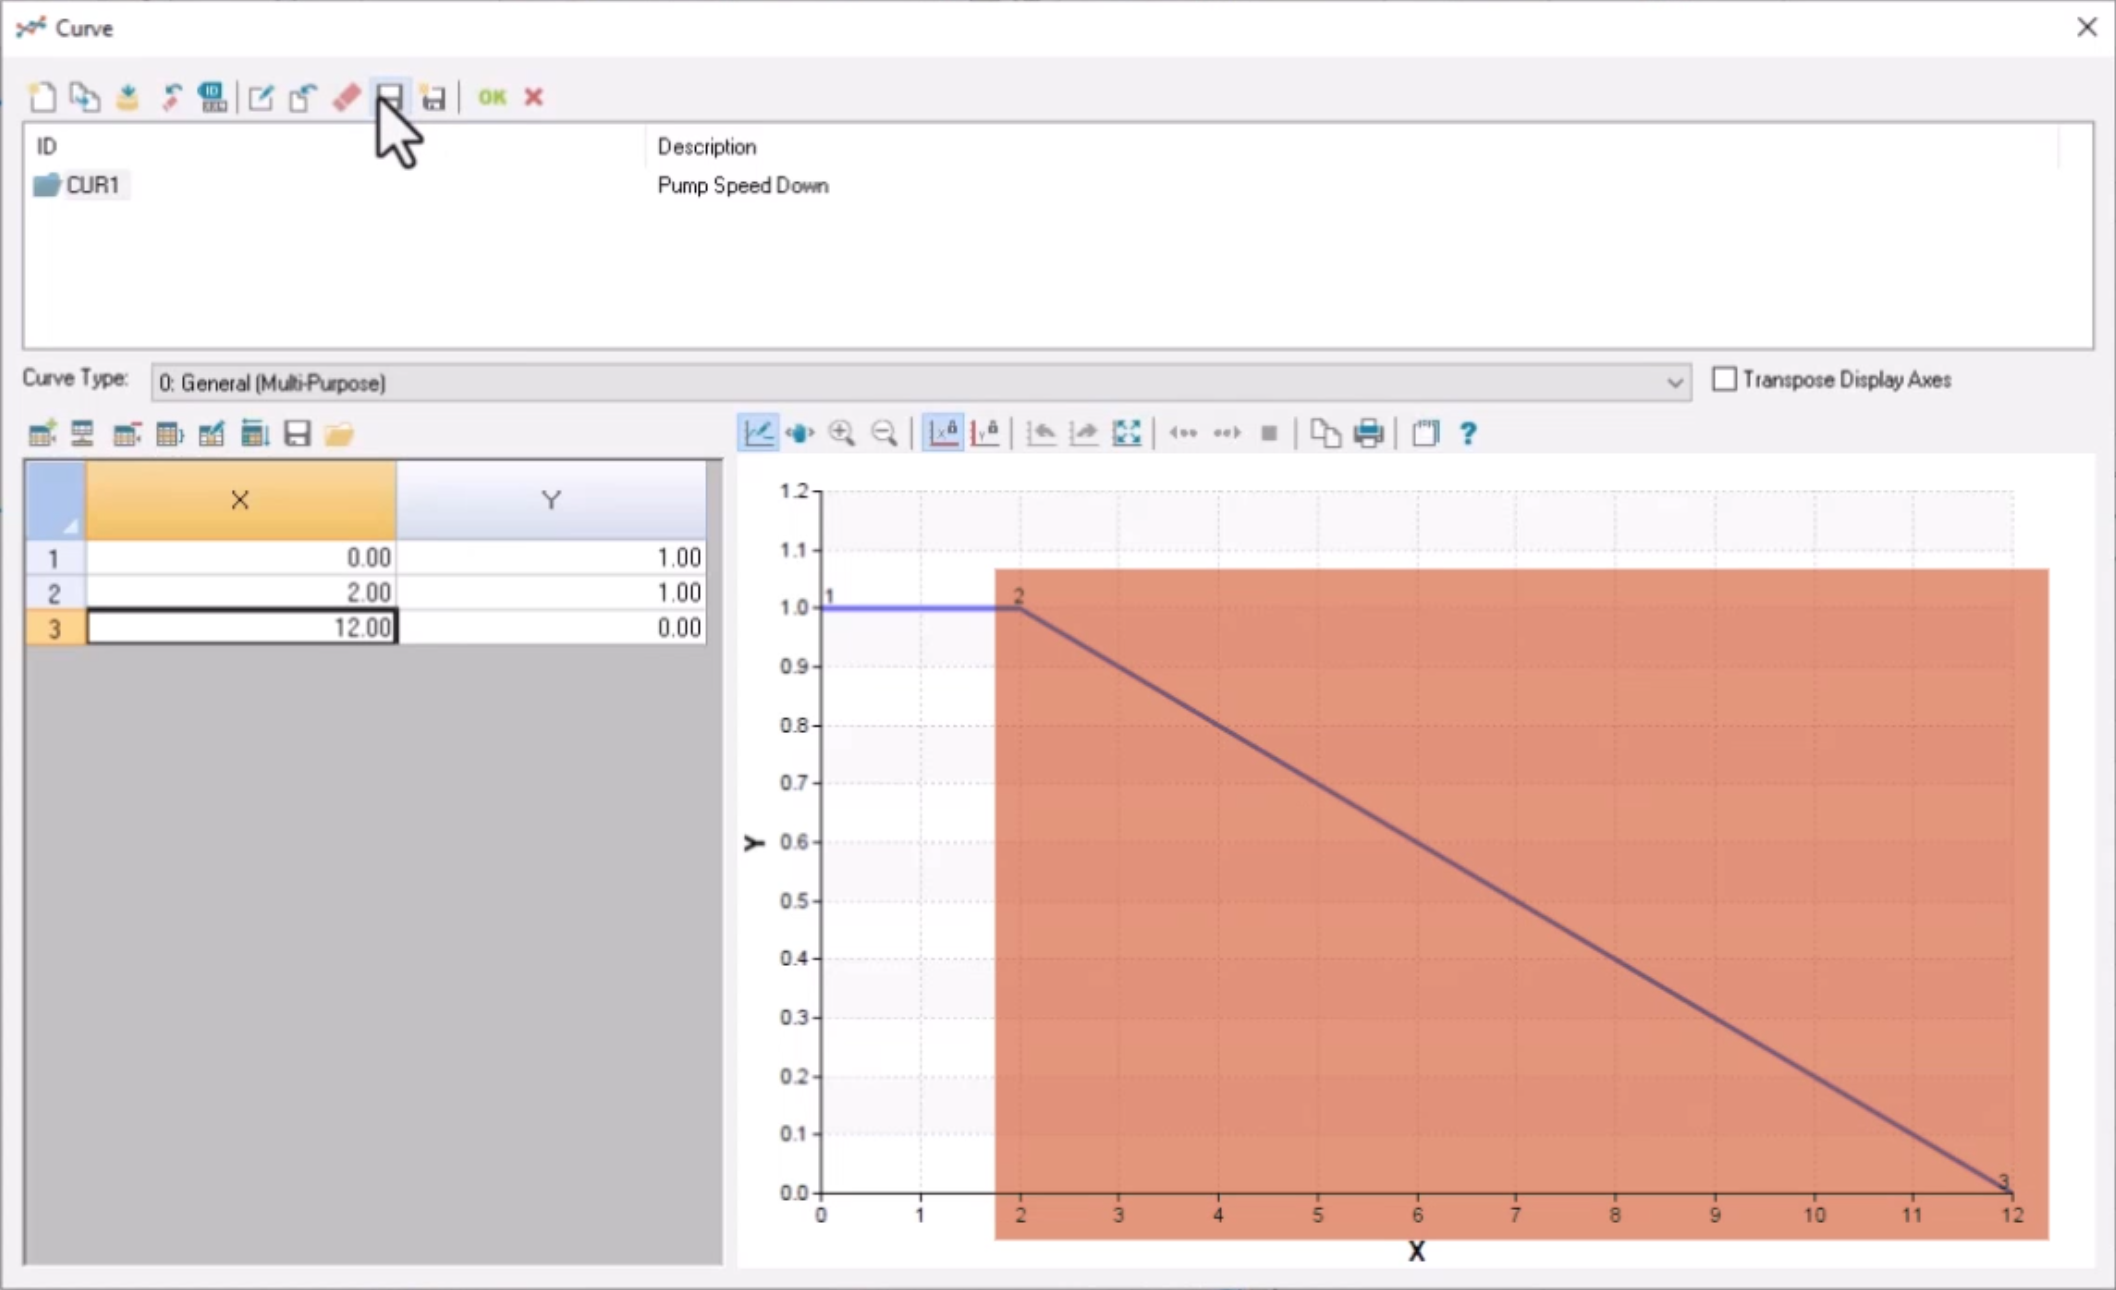
The X/Y table updates with three rows and two columns for entering values to create a pump curve, which updates automatically in line graph form.
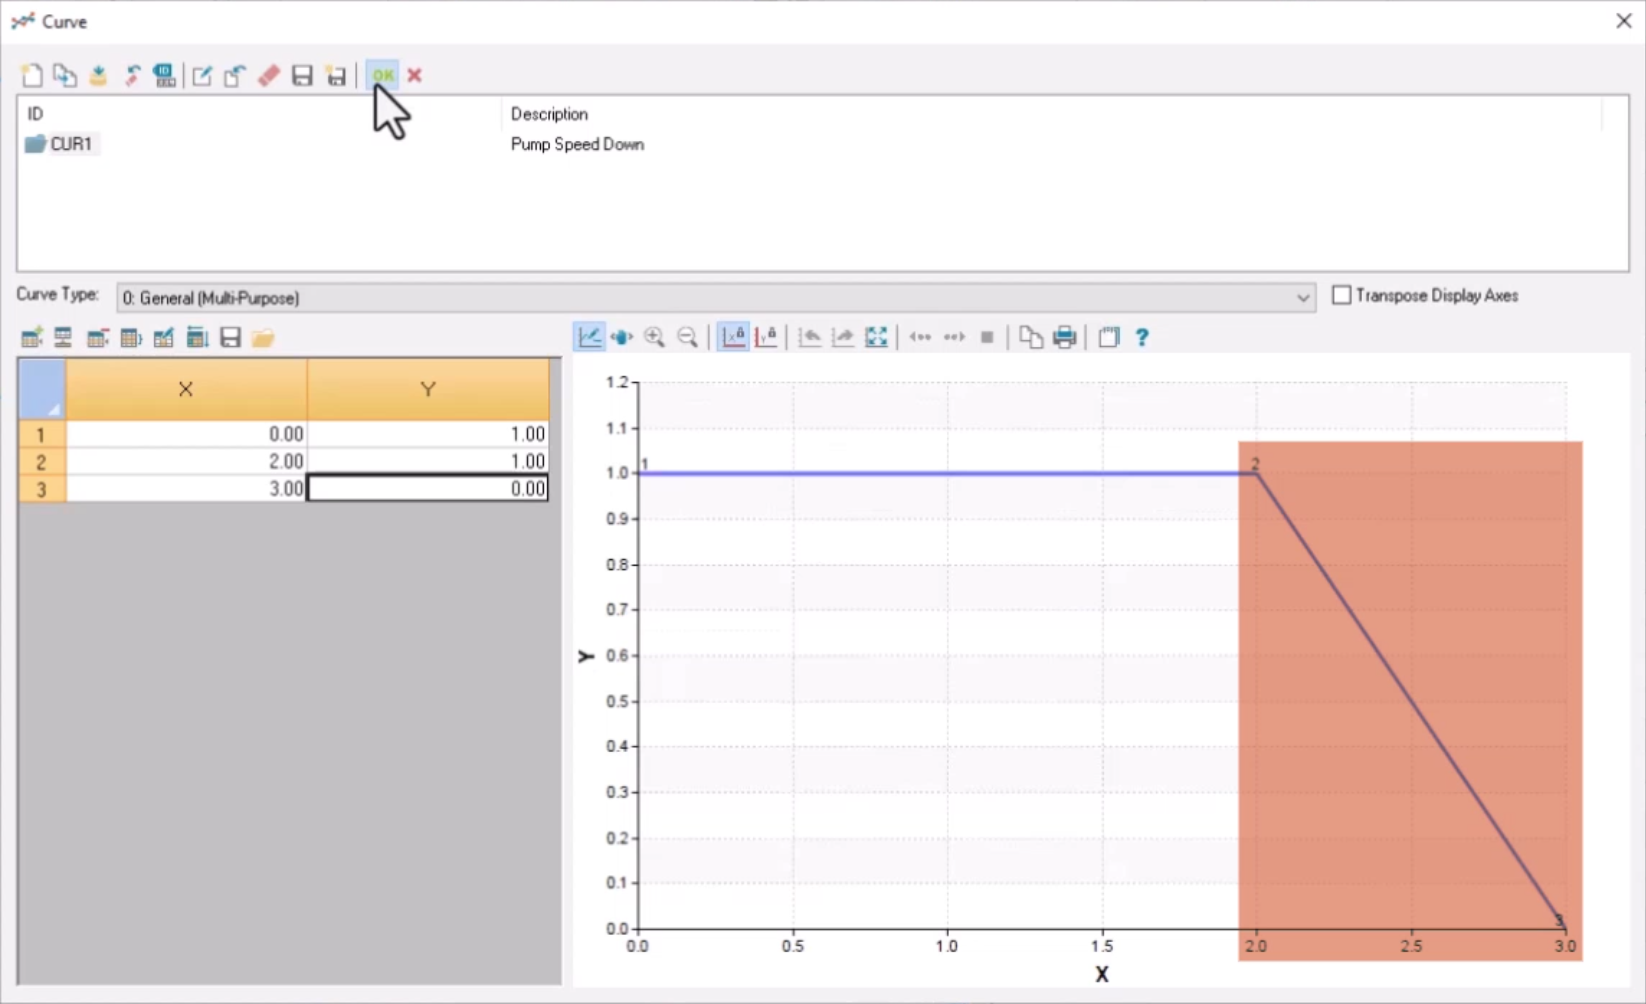
In the table, enter the following values in the X-axis column (operation time in seconds):
- In row 1, enter 0.00.
- In row 2, enter 2.00.
- In row 3, enter 3.00.
Enter the following pump speed ratio values in the Y-axis column:
- In row 1, enter 1.00.
- In row 2, enter 1.00.
- In row 3, enter 0.00.
- Click OK.
The curve indicates that after two seconds, the pump will drop from full speed (1 for 100% speed) to off (0 for 0% speed) within the next one second.
- Click OK again to close the Curve dialog box.
- In the Speed/Wicket Gate Change Data dialog box, make sure the Speed Curve drop-down is set to the name of the new curve just created.
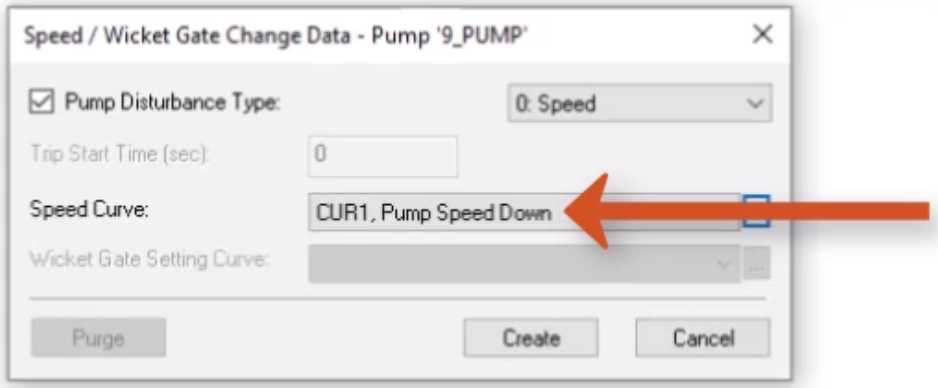
- Click Create.
Now, both steady-state and surge simulations can be run. To run the model with a hydraulic simulation:
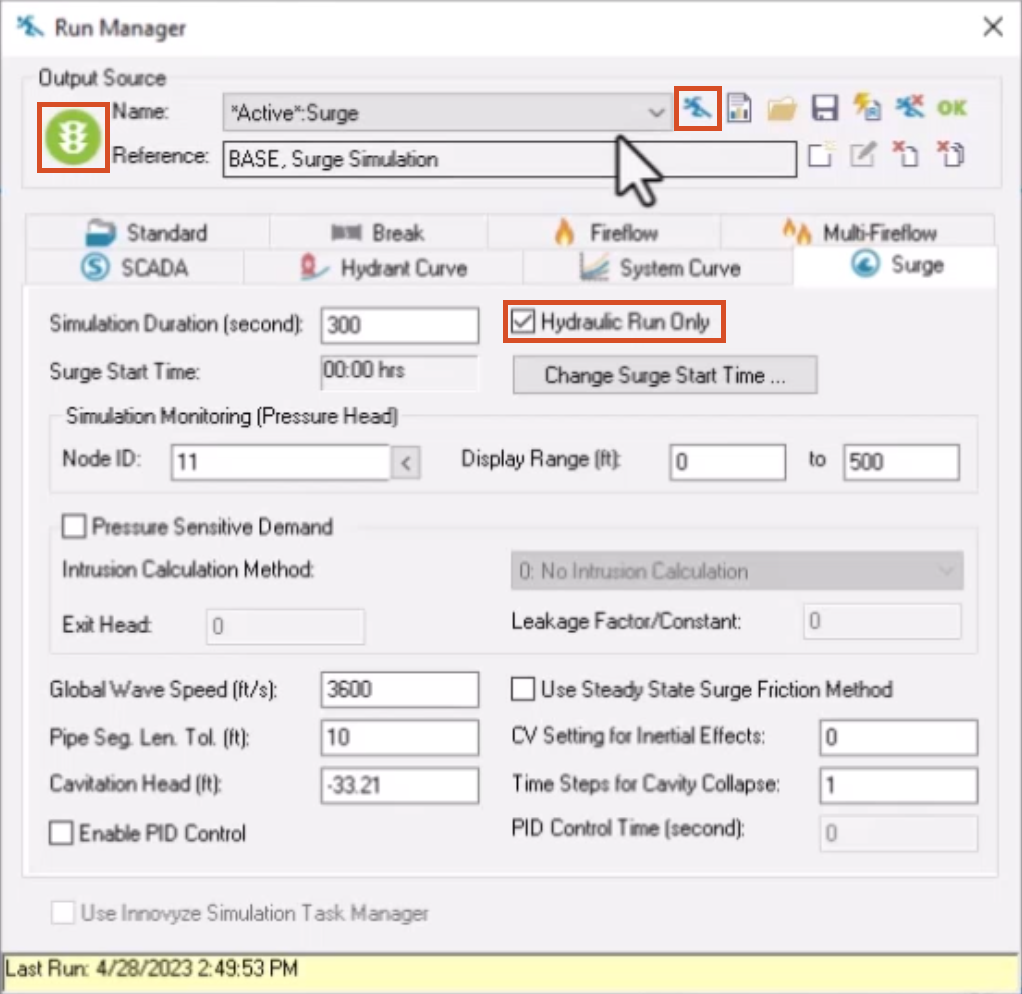
- From the Model Explorer, click Run Manager.
- In the Run Manager, open the Surge tab.
- Enable Hydraulic Run Only.
- Click Run.
Upon successful completion, under Output Source, a green light icon appears.
Now, a surge analysis can be run:
- Deselect the Hydraulic Run Only option.
- Click Run to perform the surge analysis.
- Click OK to close the Run Manager.
- If prompted to switch to the most recent run output data, select Yes.
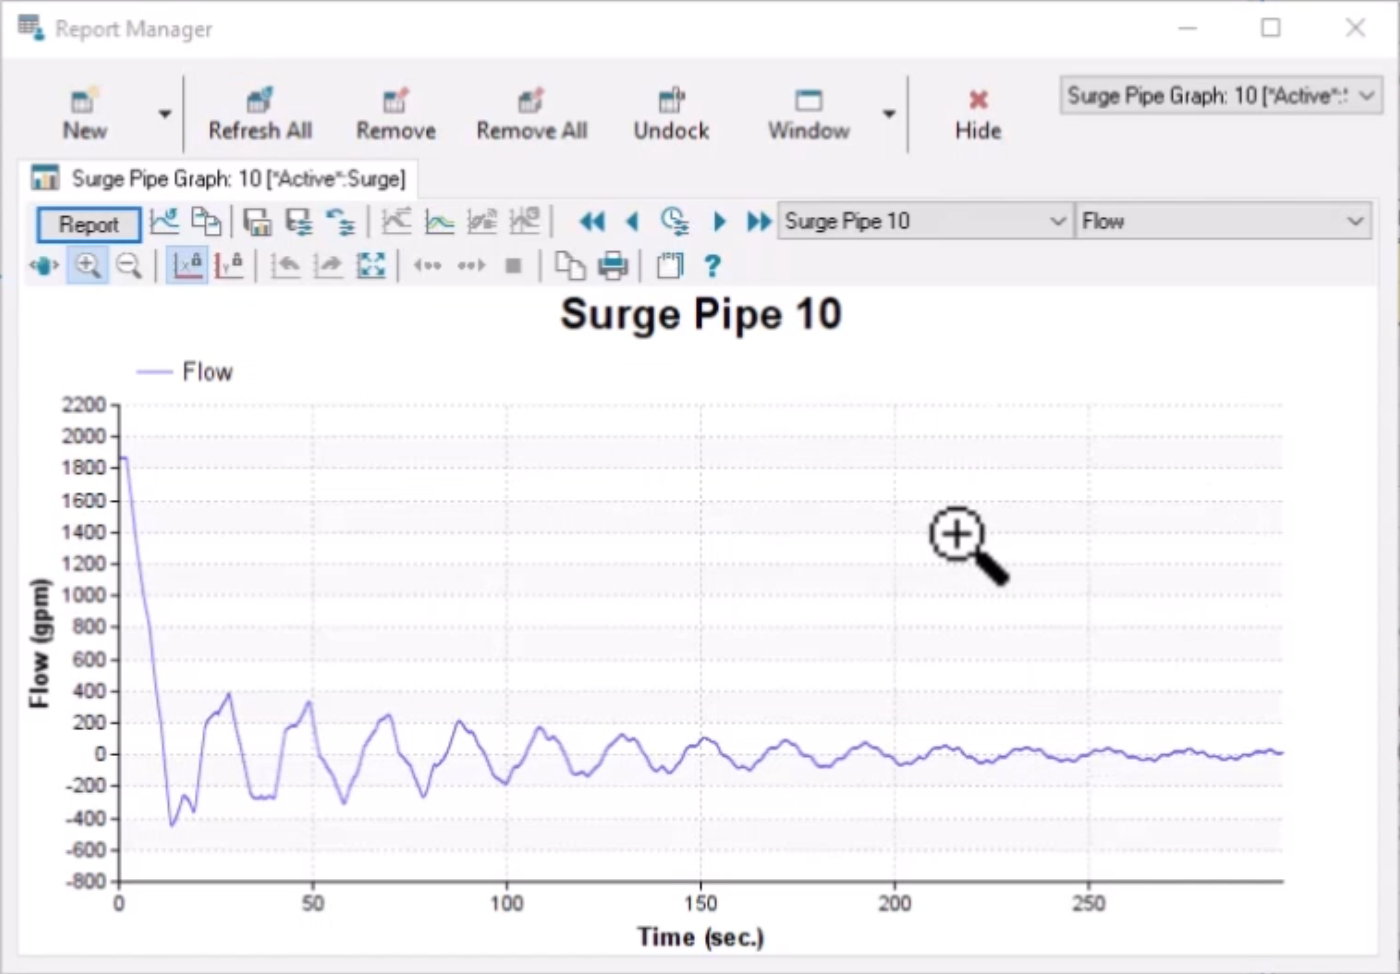
Results from the simulation can be viewed in graph or tabular format. This example views the effect of the surge simulation on flow through a pipe downstream of the pump experiencing the shutdown event.
- From the ribbon, InfoWater Pro tab, View panel, click Report Manager.
- In the Report Manager dialog box, click New to open the Output Report/Graph dialog box.
- Under Available Output Sources, select *Active*.Surge.
- Open the Graph Report tab.
- Select Surge Pipe Graph.
Note that in the Data Scope group box, the default option Selected Element(s) is enabled.
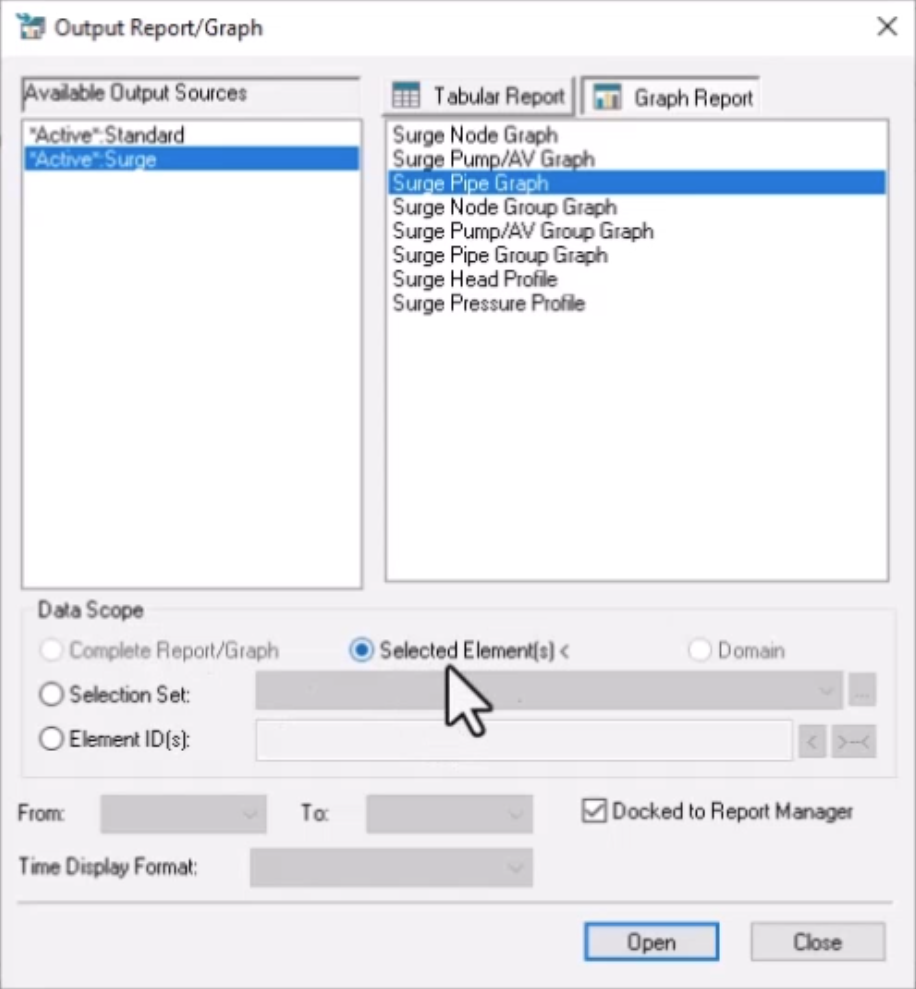
- Click Open.
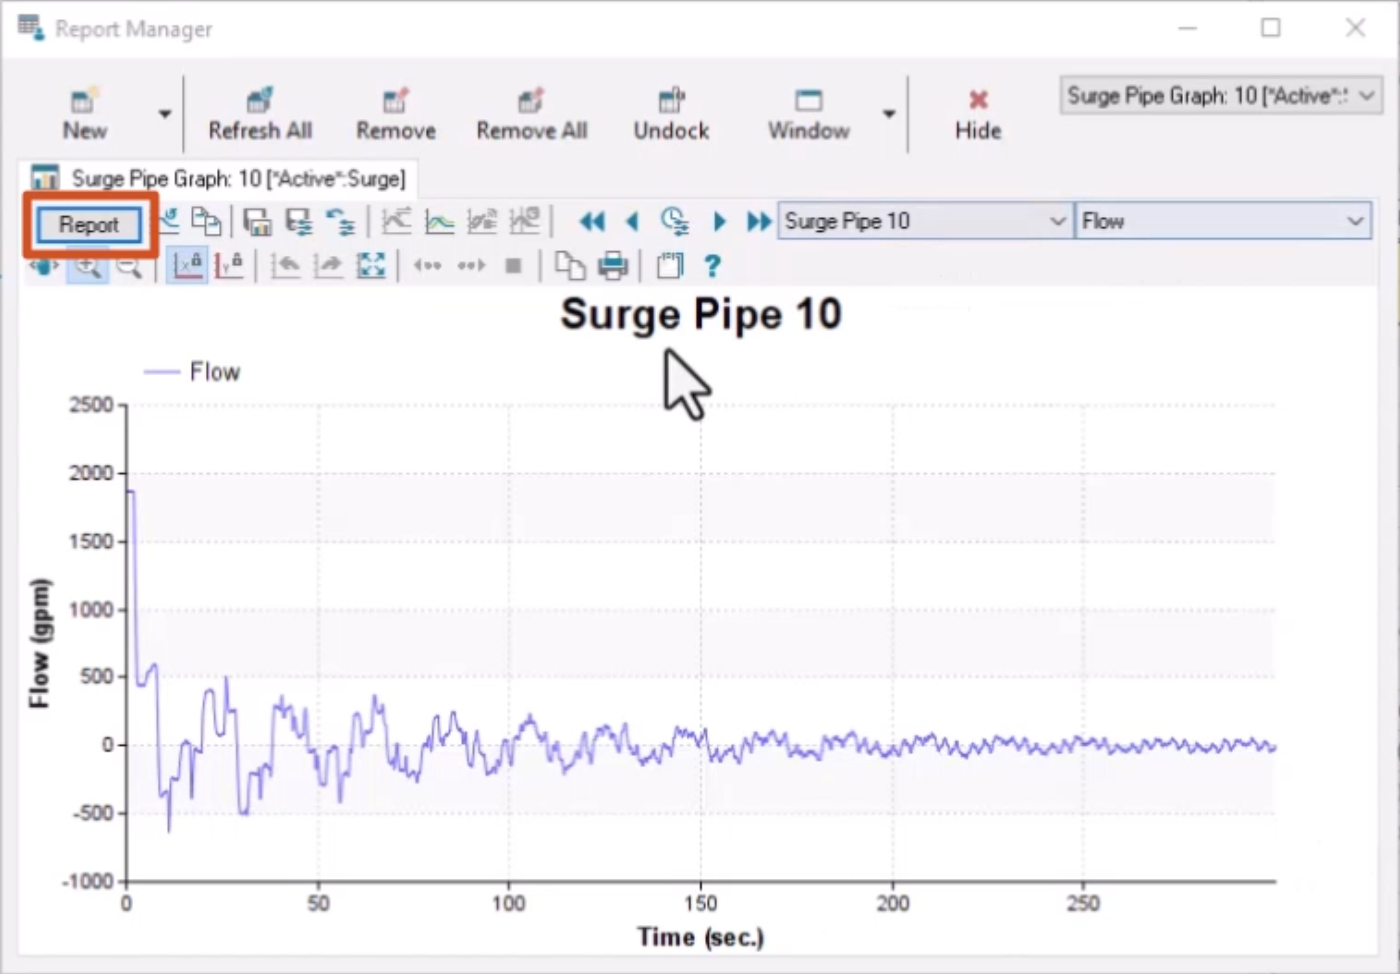
- From the map, select Pipe 10, which represents a typical pump shutdown response.
- Review the graph and, if needed, click Report to see data for the entire run in a table format.
- Close the Report Manager.
Next, compare these results to a new simulation run without a check valve, to better understand the effects of modeling a check valve in a system.
- From the map, select pump 9_PUMP.
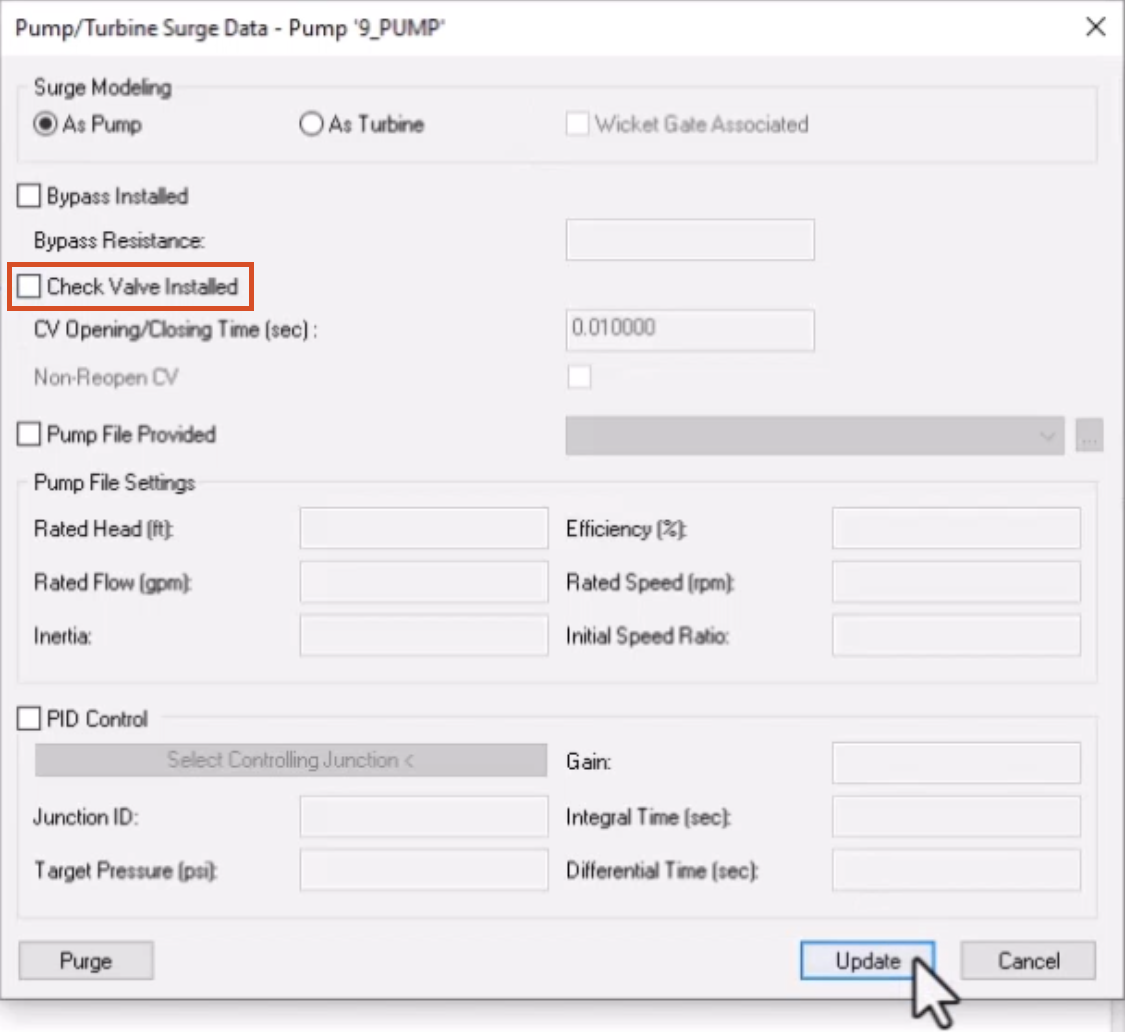
- Click the Pump Surge Data button to open the Pump/Turbine Surge Data dialog box.
- Disable Check Valve Installed.
- Click Update.
- Reopen the Run Manager.
- Click the Run button to run a surge analysis.
- Click OK to close the Run Manager.
- Reopen the Report Manager.
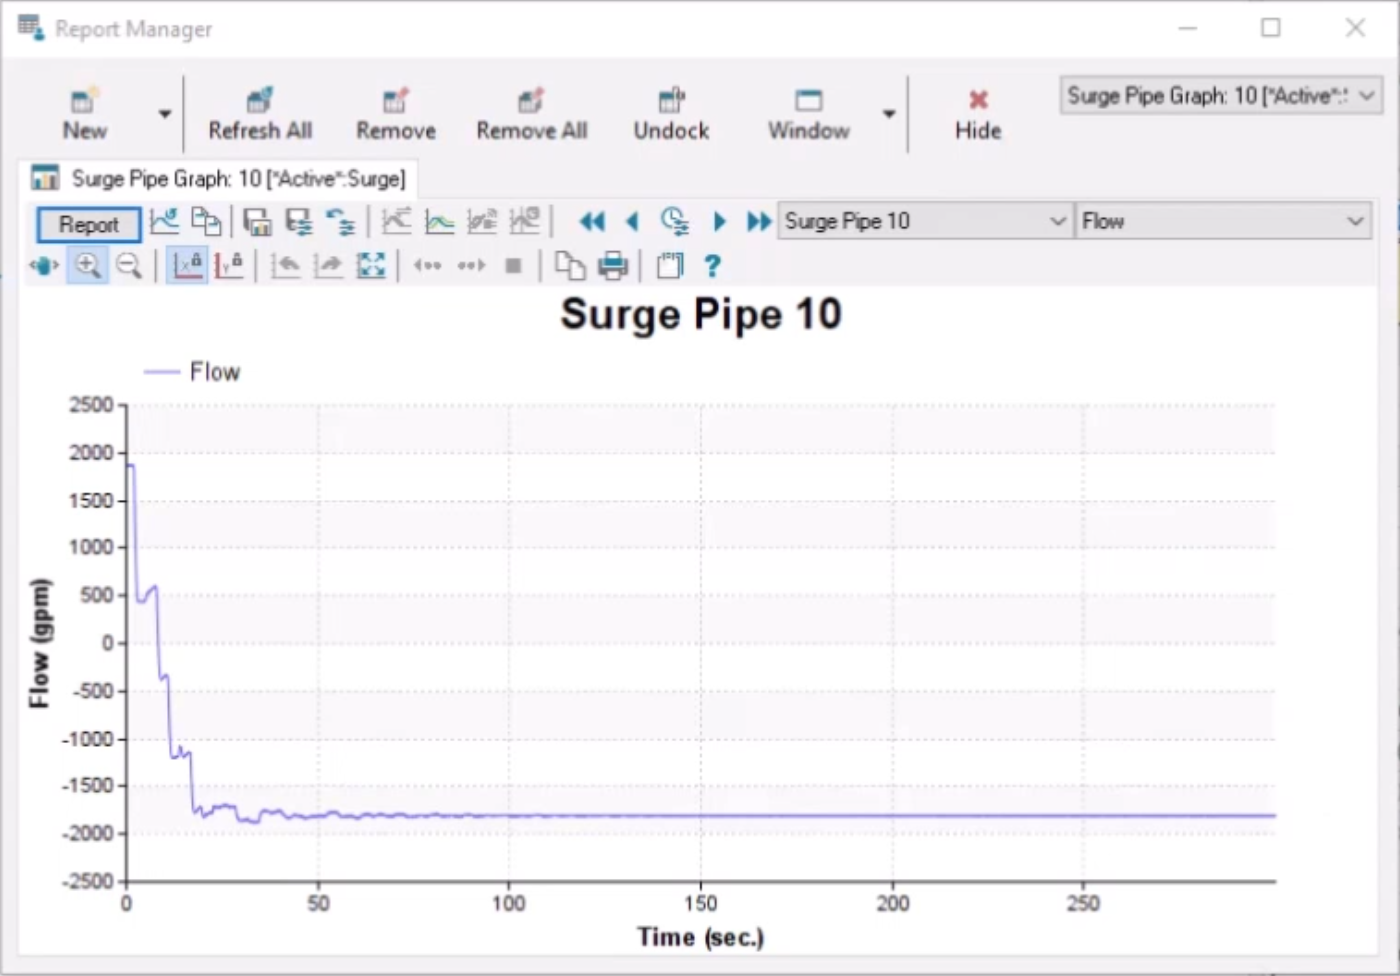
- Click Refresh All to refresh the output for pipe 10.
Notice the difference in flow from the previous run. Without the check valve to prevent reverse flow, additional flow can go through the pipe.
- Close the Report Manager.
While shorter shutdown times create greater surge events, a slower shutdown produces less of a transient event.
To use a longer pump speed change operation time to increase the pump shutdown time and minimize the impact of the surge event:
- From the map, select pump 9_PUMP.
- In the Model Explorer toolbar, click Pump Surge Data.
- In the Pump Surge Data dialog box, enable Check Valve Installed.
- Leave the CV Opening/Closing Time set to 0.01 seconds, noting that the software remembers the previously entered time.
- Click Update.
- From the Model Explorer, click the Pump Operation Change button to open the Speed/Wicket Gate Change Data dialog box.
- Click Browse (...) to reopen the Curve dialog box.
- Ensure the CUR1 curve ID is selected.
- In the X-column, set the value in row 3 to 12.00.
This greatly extends the pump speed downtime from 1 second to 10 seconds.
- Click Save.
- Click OK.
- In the remaining dialog box, click Update.
- Reopen the Run Manager and select Run to begin a surge analysis.
To refresh the output for pipe 10 and view the results:
- Reopen the Report Manager and click Refresh All.
Notice that the surge event is greatly reduced.
This process could be repeated with different shutdown times to identify how slow the pump shutdown would need to be to avoid a surge event.