Setting up 2D themes and basic results analysis
Display the simulation results of a 2D analysis utilizing themes and the Pick Graph and Properties tools.
Tutorial resources
These downloadable resources will be used to complete this tutorial:
Step-by-step guide
In InfoWorks ICM, themes allow a particular field or result value to be displayed graphically. This can be useful for displaying the flood extents from simulation results. In this example, flood extents are set up and displayed in 2D to show the depth, direction, and speed of the water as it approaches and bursts a structure.
- Select Open > Open transportable database.
- Navigate to and select the .icmt file.
- Click Open.
- If a popup displays about opening the database as read-only, click Yes.
- Right-click the top-level folder and select Copy.
- In the popup, click Continue.
- In the Explorer window, right-click the Database and select Paste (with children).
- In the Copying pop-up, enable Copy simulation results.
- Click Continue.
- For this example, open 2D Dam Breach on the GeoPlan to ensure the model opens with the simulation results applied.
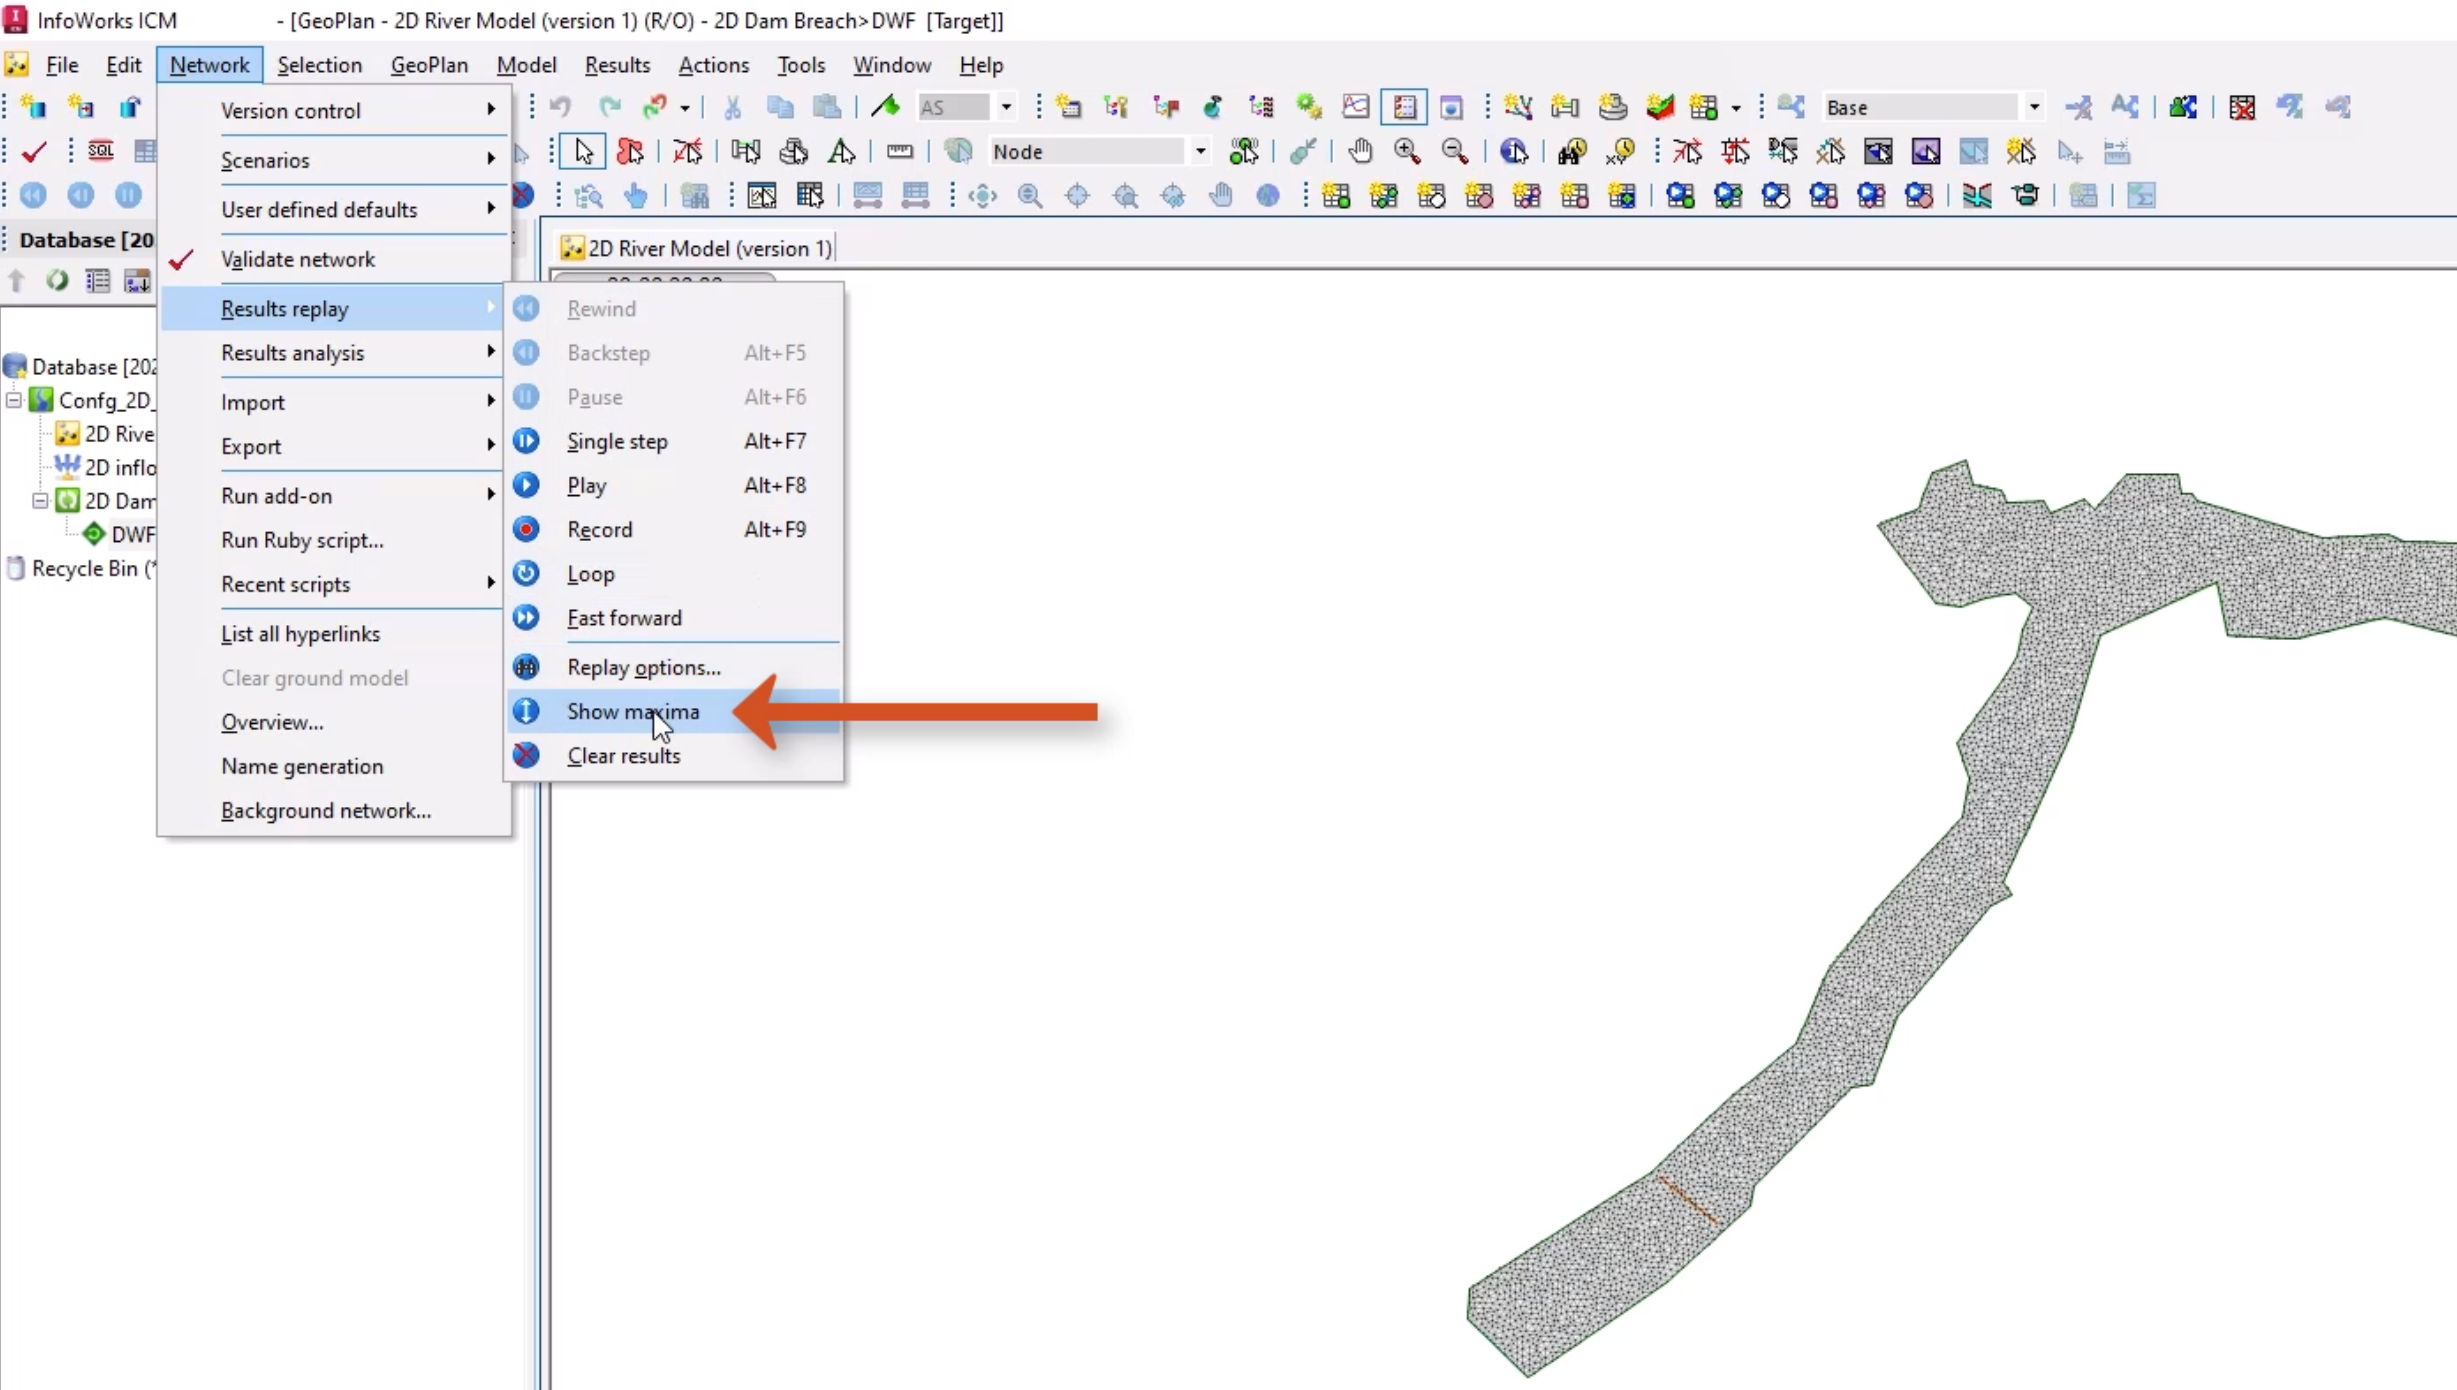
- To view changes while working, expand the Network menu and select Results Replay > Show maxima.
A factory default theme is displayed and can be customized. First, create a sub theme that displays water depth for the 2D zone object layer:
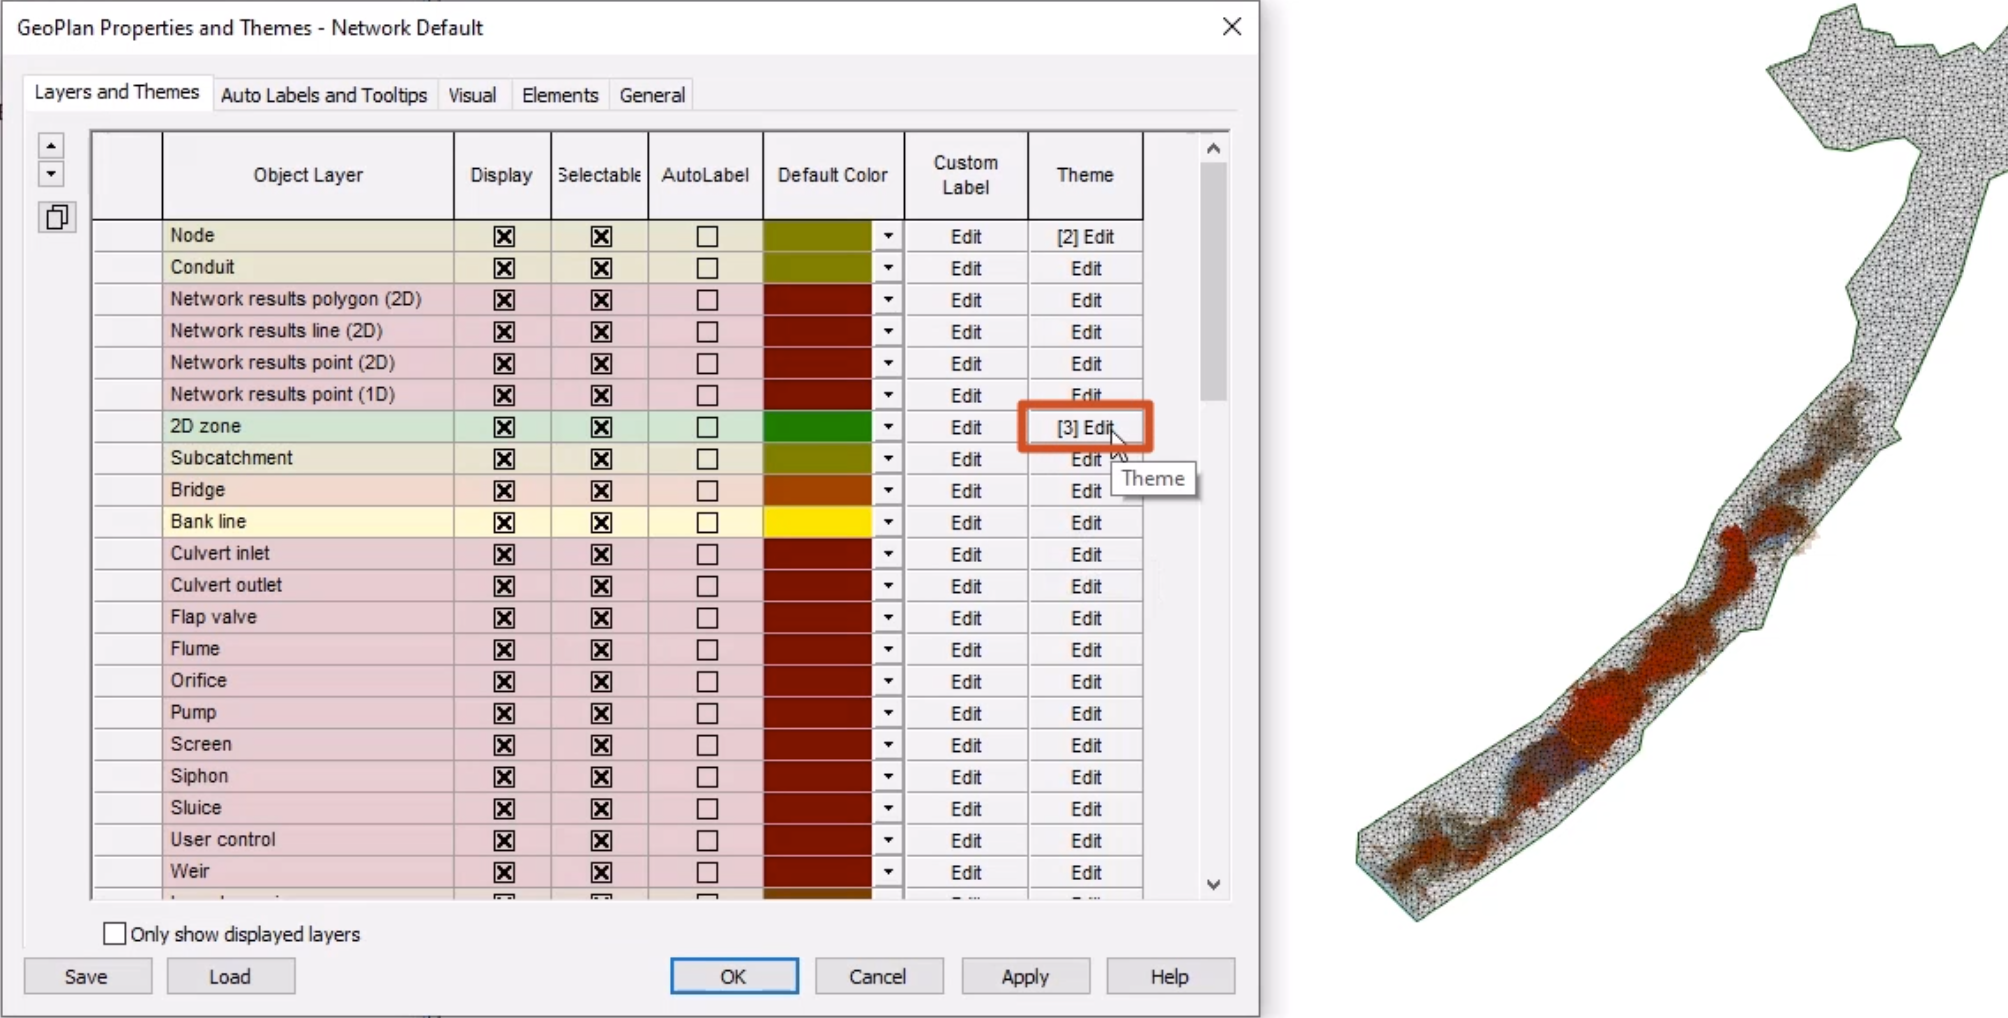
- Right-click the GeoPlan and select Properties & themes.
- On the Layers and Themes tab, 2D zone row, Theme column, select Edit.
The Layer Theme Editor opens with the Base Theme, Flow Arrows and depth2d sub themes. To add a new theme:
- In the Sub Theme Manager Pane, on the toolbar, select Add.
In this instance, default themes can be edited to enhance the display.
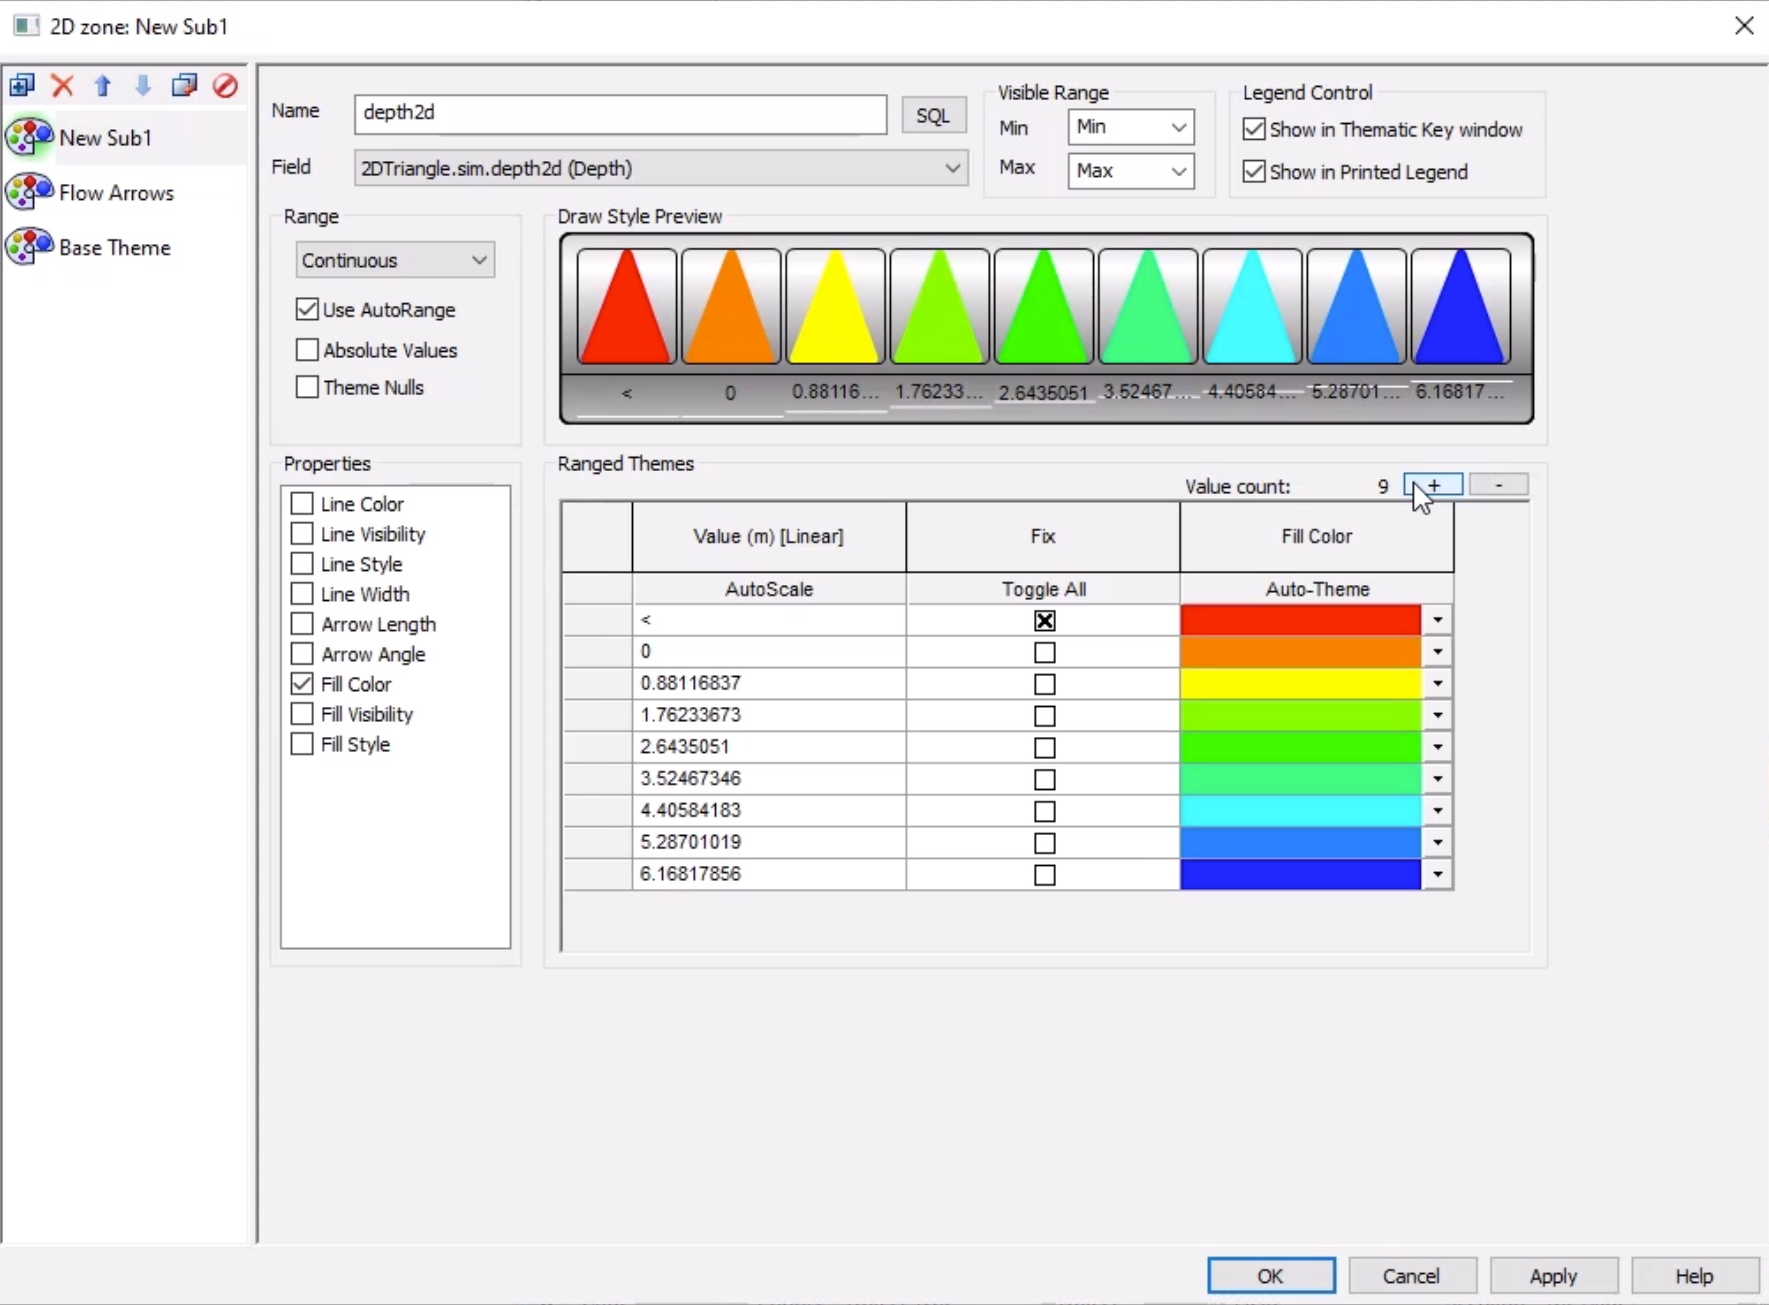
- Select the depth2d sub theme.
Note that the Field drop-down has the 2DTriangle.sim.depth2d (Depth) result field selected. The Name of the theme will automatically populate and can be changed as needed.
In the Ranged Themes section, a range of values is set for each color in the theme. To add additional values:
- Next to Value count, click the plus (+) button to increase the value to 9.
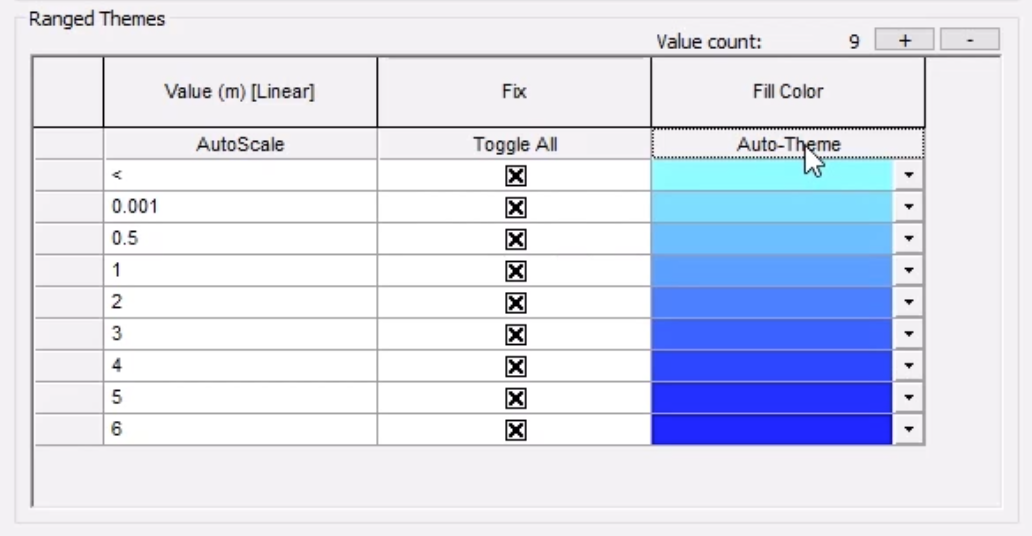
- In the Fix column, select Toggle All.
In the Value column, ensure that the minimum depth is set above zero to prevent all triangles from being colored:
- Starting with the second row, enter the values 0.001, 0.5, 1, 2, 3, 4, 5 and 6.
In the Fill Color column, set the colors of each depth to make it easier to distinguish the depth of water:
- In the first row, expand the color drop-down and choose a light color. The Draw Style Preview panel updates.
- Optionally, click Auto-Theme to cycle through different color palette options.
During a presentation, most audiences expect gradient shades of blue. For results analysis, different color bands may be preferred.
The opacity of each color can also be adjusted:
- Under Properties, select Fill Visibility.
- In the Fill Visibility column, in the first row, move the slider to approximately the center position.
- Click Auto-Theme to interpolate between the top and bottom rows, to create a smooth transition.
- In the first row, adjust the Fill Visibility slider to 0, to prevent it from being displayed.
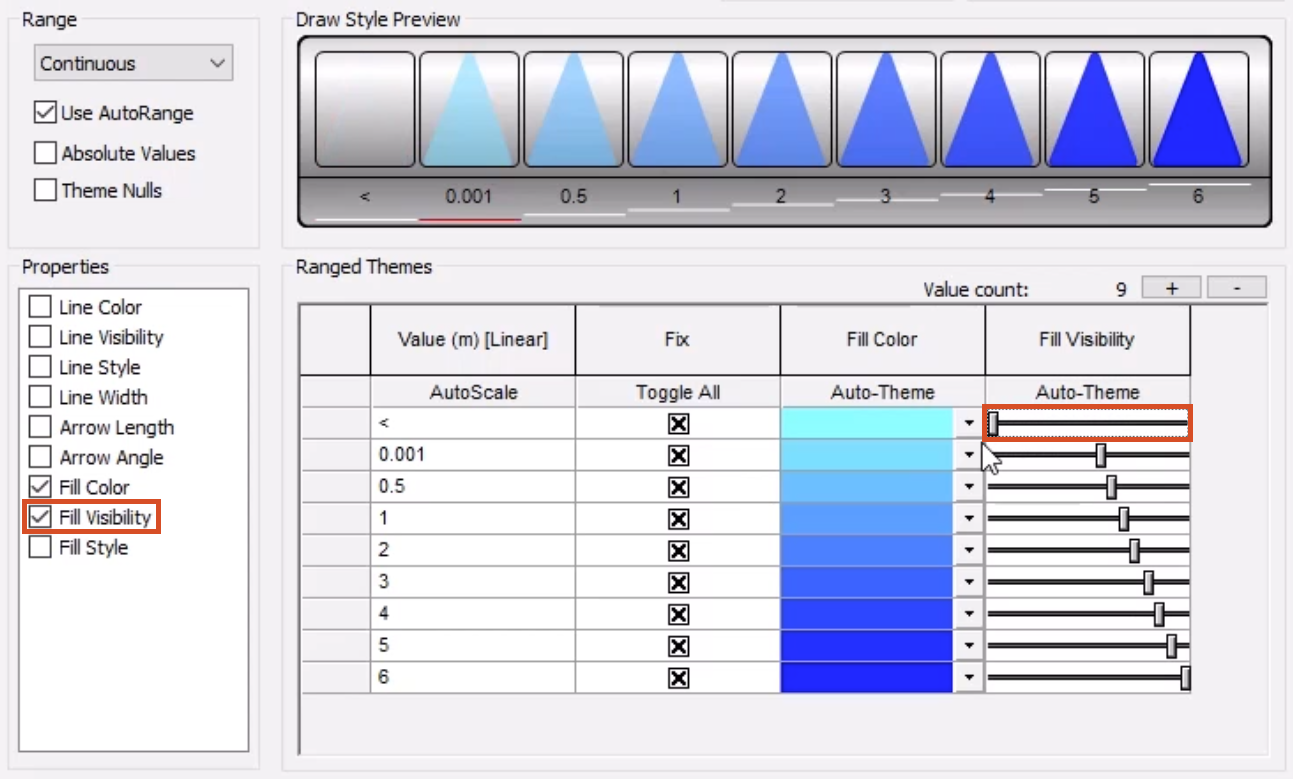
- Click Apply to save this sub theme for water depth.
Next, adjust the sub theme that displays water speed and direction:
- Select the Flow Arrows sub theme, and note that in the Field drop-down, 2DTriangle.sim.speed2d (Speed) is selected.
- Set the Value count to 8.
- In the Fix column, select Toggle All.
- In the Arrow Length column, first row, expand the drop-down and select 0.
- In the final row, select 140.
- Click the Auto-Theme button, and the rows update to gradually increase the arrow length.
- In the Value column, update rows 2 through 8 with the values 0.1, 1, 2, 3, 4, 5 and 6.
- In the Line Color column, expand the first drop-down, and for this example, select yellow.
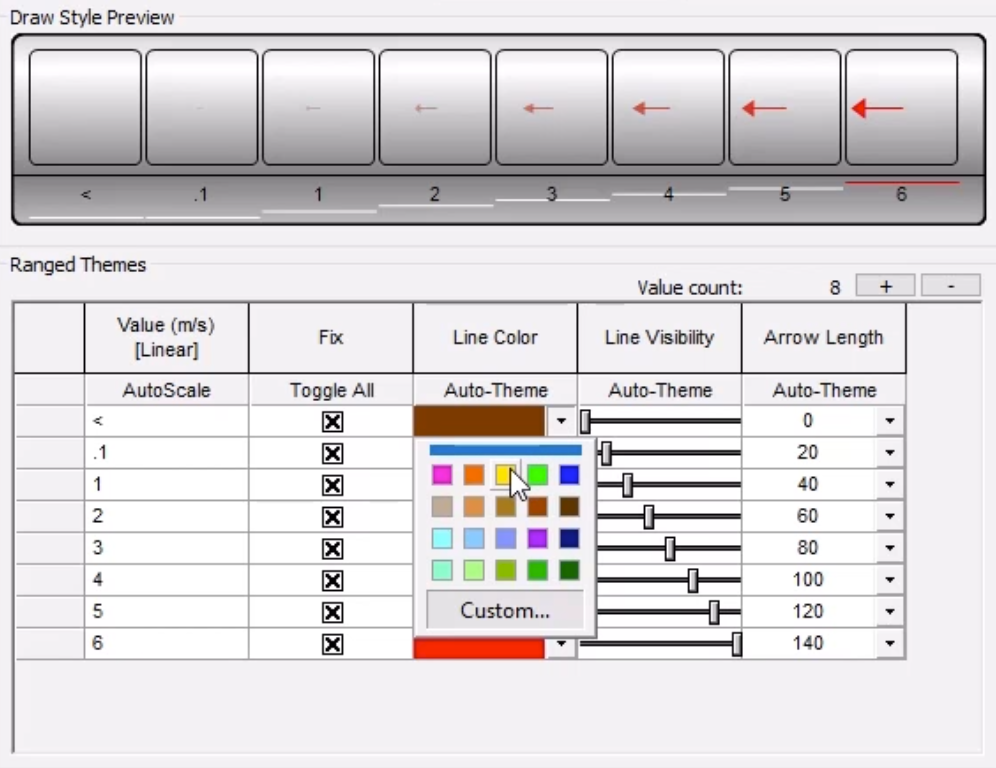
- In the final row, expand the drop-down and click Custom.
- In the Color dialog box, under Basic colors, select red.
- Click OK.
- In the Line Color column, click Auto-Theme several times to create a gradient from yellow to red.
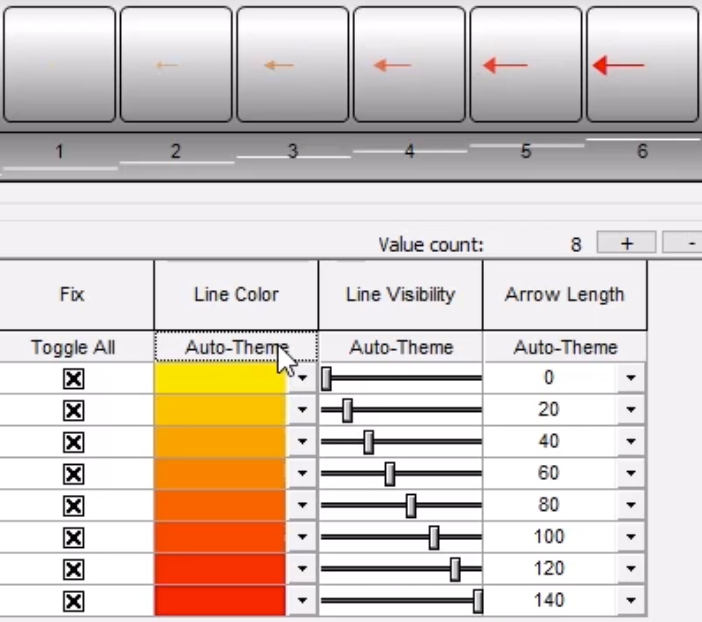
- Click OK.
- View the 2D river model with the new themes applied, and confirm that the properties selected for the themes are logical and visually differentiated.
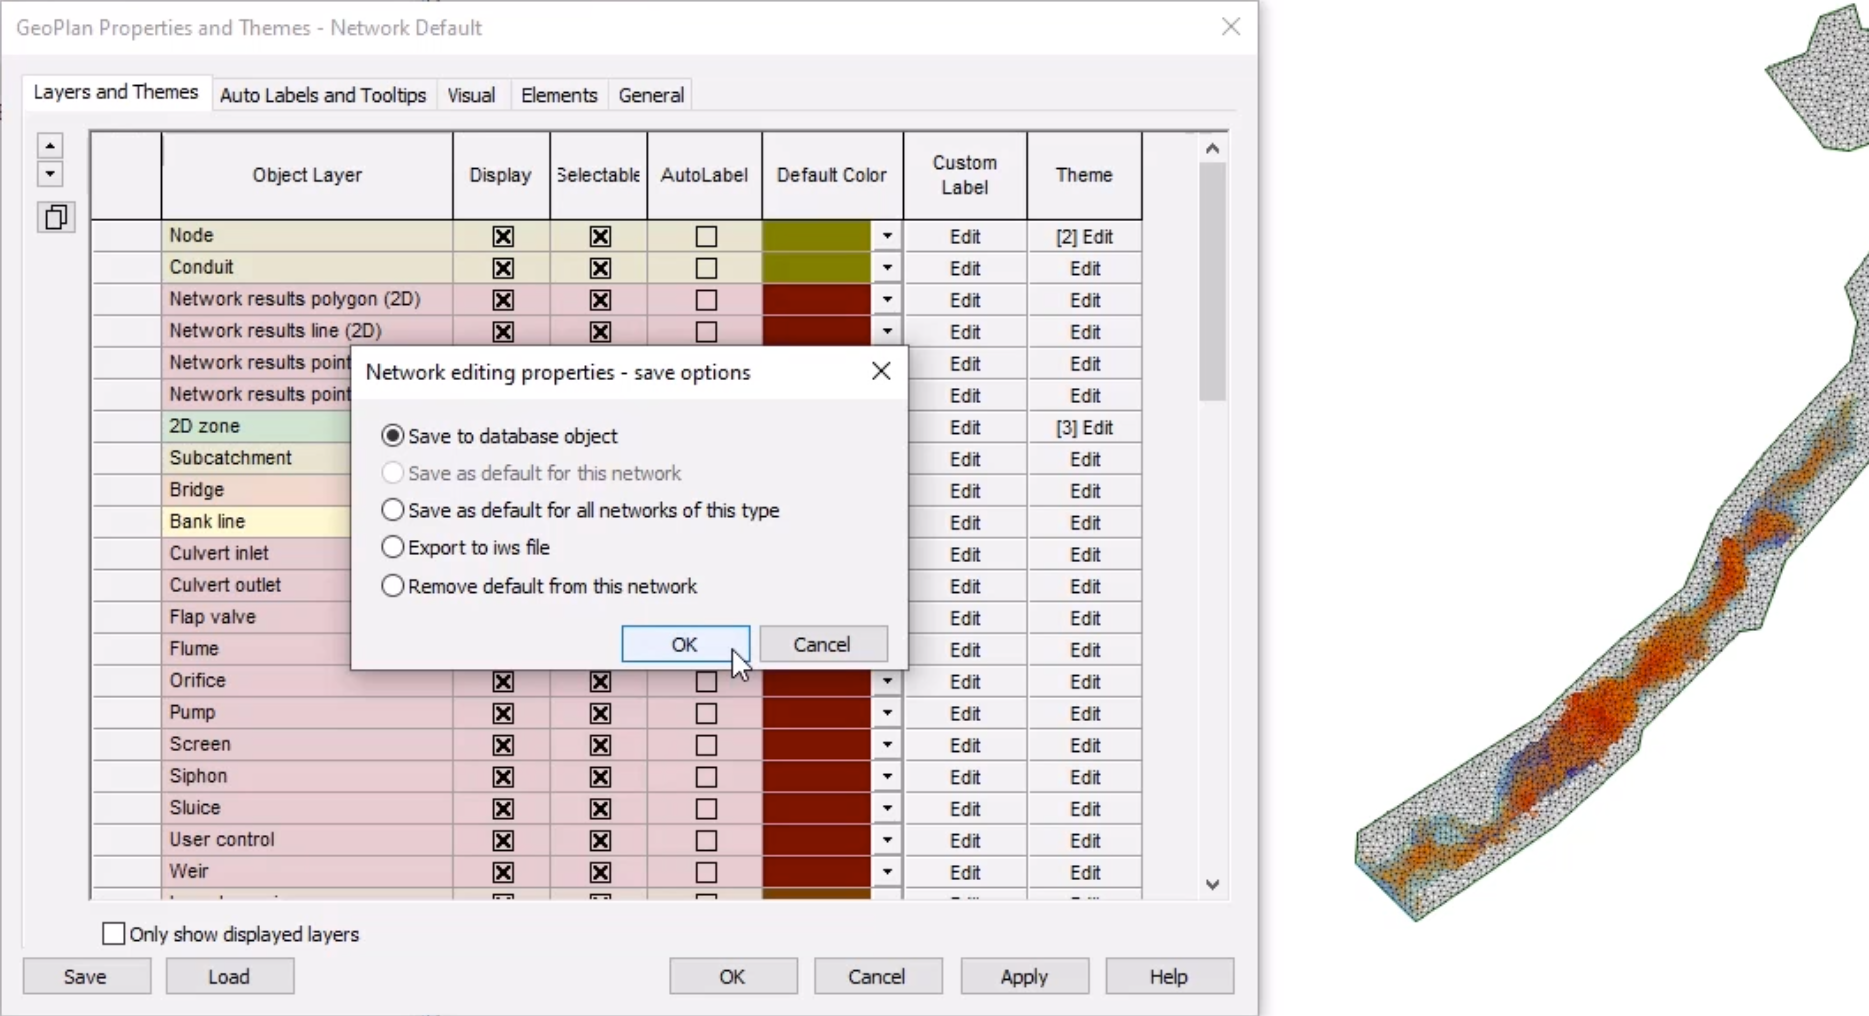
- In the GeoPlan Properties and Themes dialog box, select Save.
- In the Network editing properties – save options dialog box, leave the default Save to database object selected, and click OK.
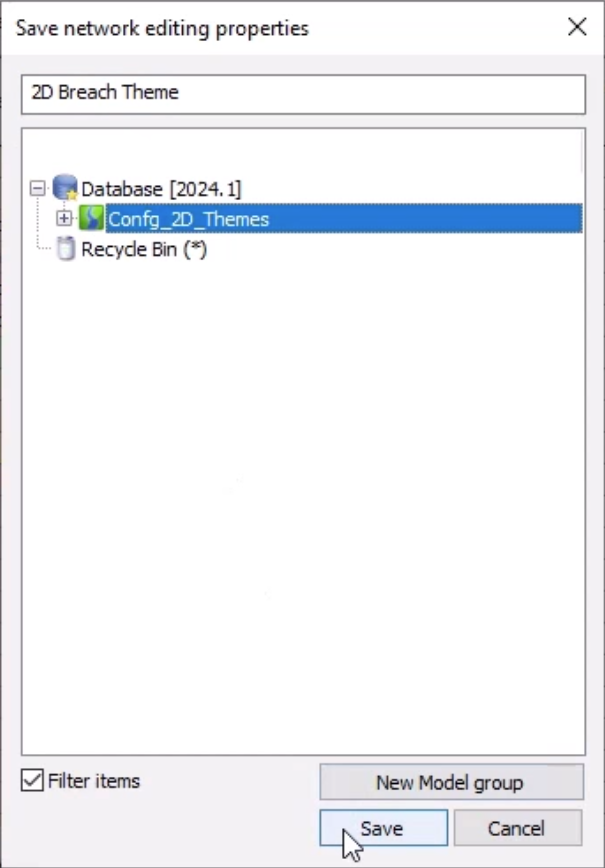
- In the Save network editing properties dialog box, select the database.
- For this example, enter the name “2D Breach Theme”.
- Click Save.
- In the Select Properties to Save dialog box, click OK.
- Click OK to close the GeoPlan Properties and Themes dialog box.
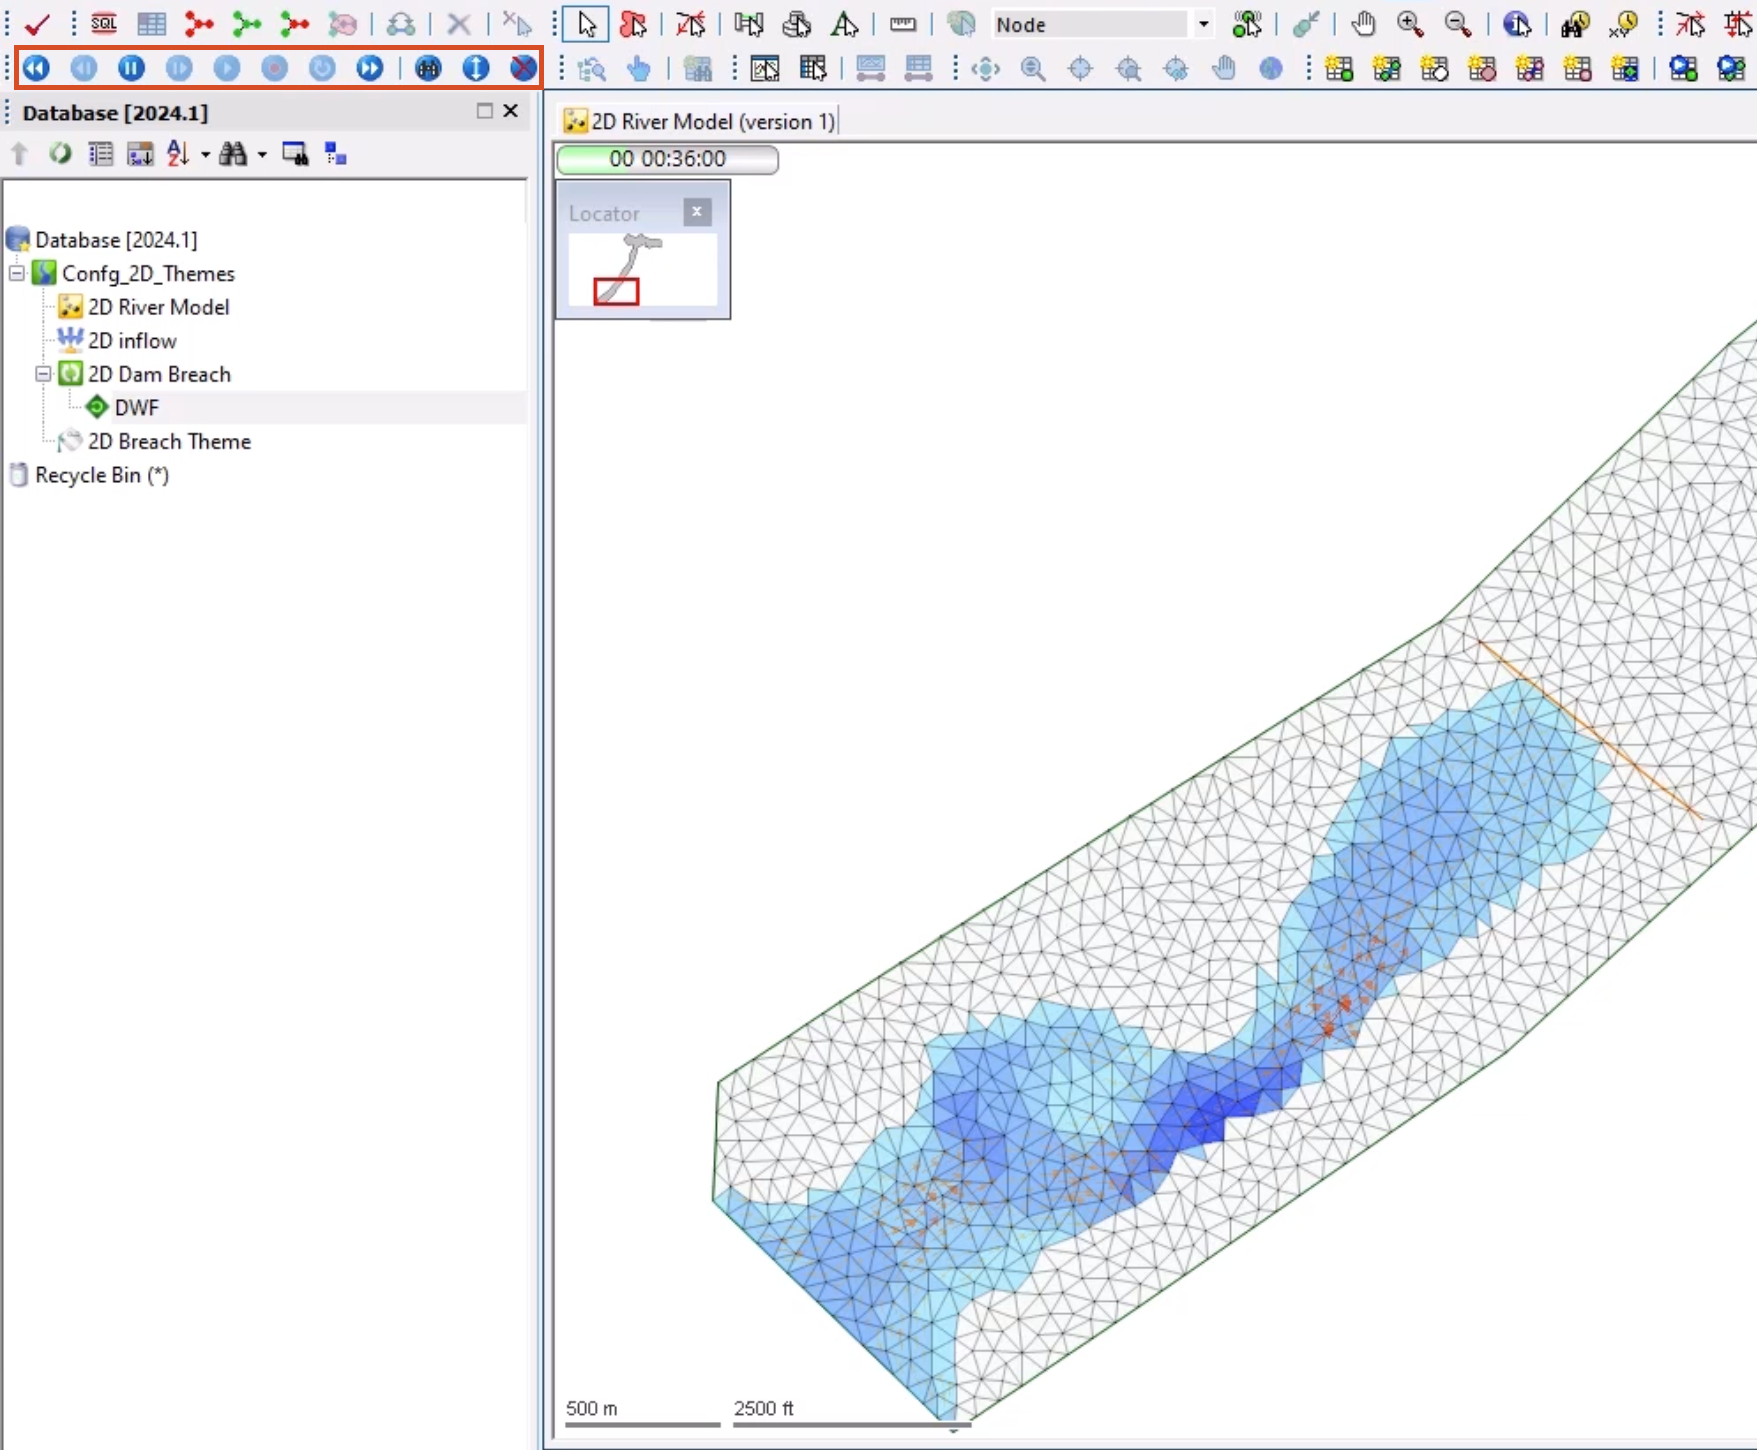
In the Explorer window, under the database, the 2D Breach Theme is added.
To view the 2D Breach Theme applied to the simulation:
- On the Replay Control toolbar, select Rewind.
- Click Play.
As the simulation plays, water enters the model, with arrows showing the direction of flow. Darker shades of blue indicate more depth as water starts to pool and build at the structure.
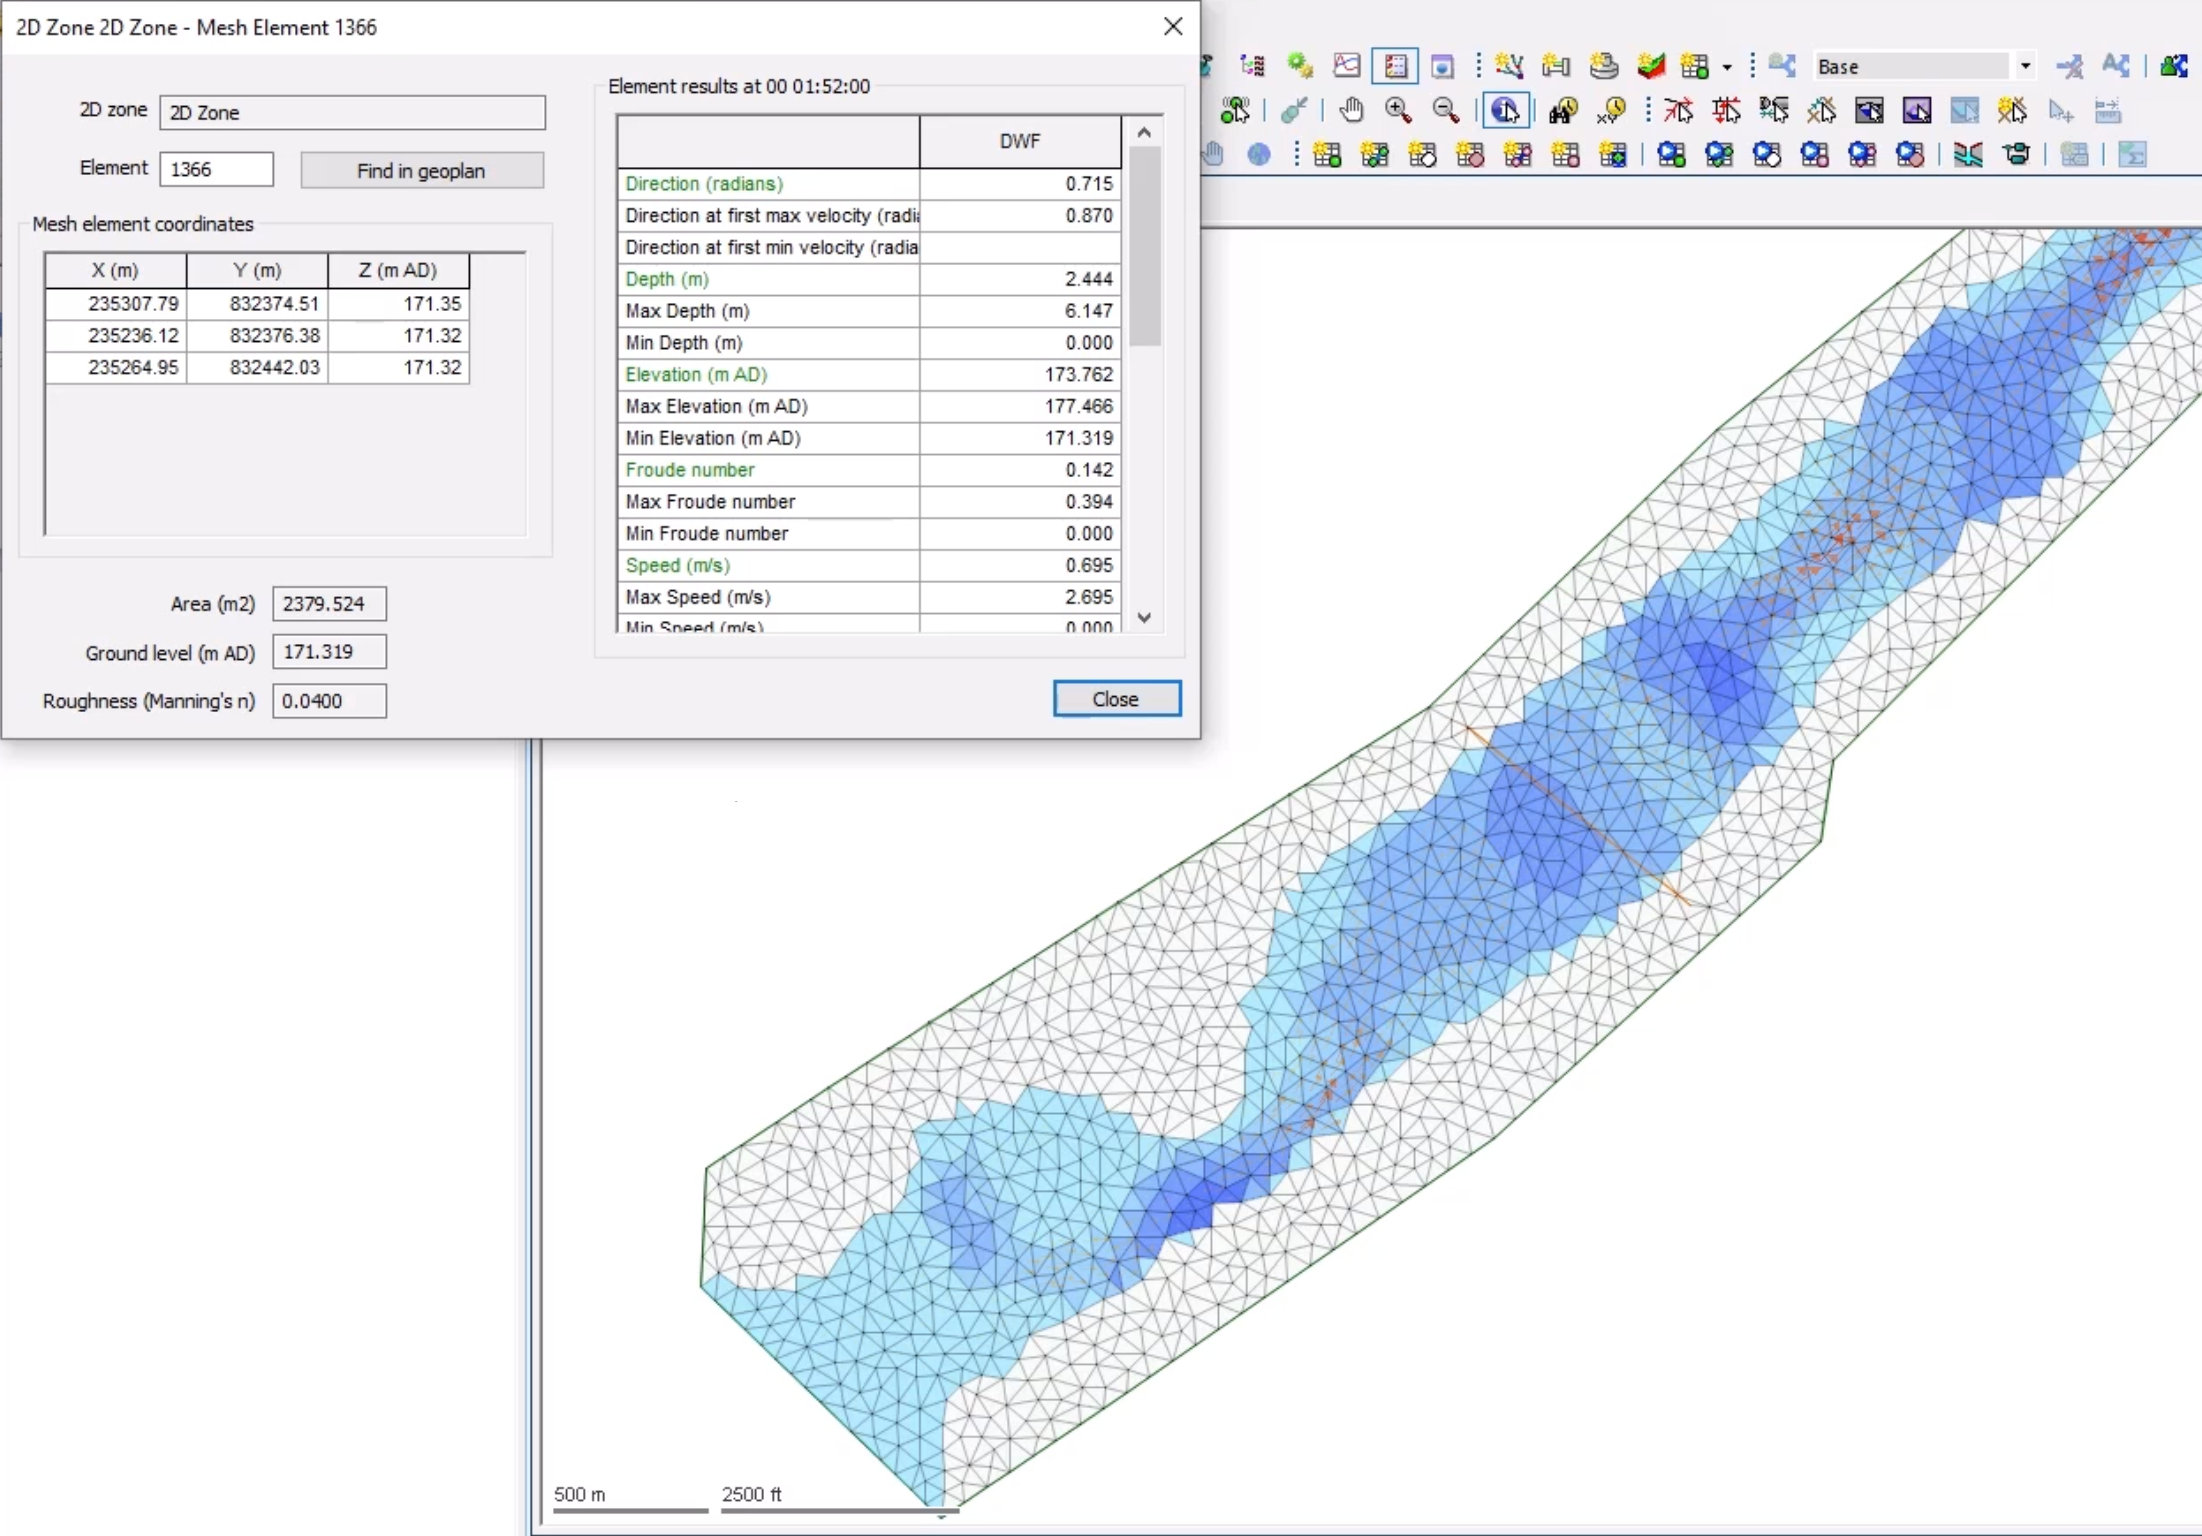
To view results for an individual element:
- In the GeoPlan Tools toolbar, select the Properties tool.
- Select an element.
The element properties dialog box displays the results.
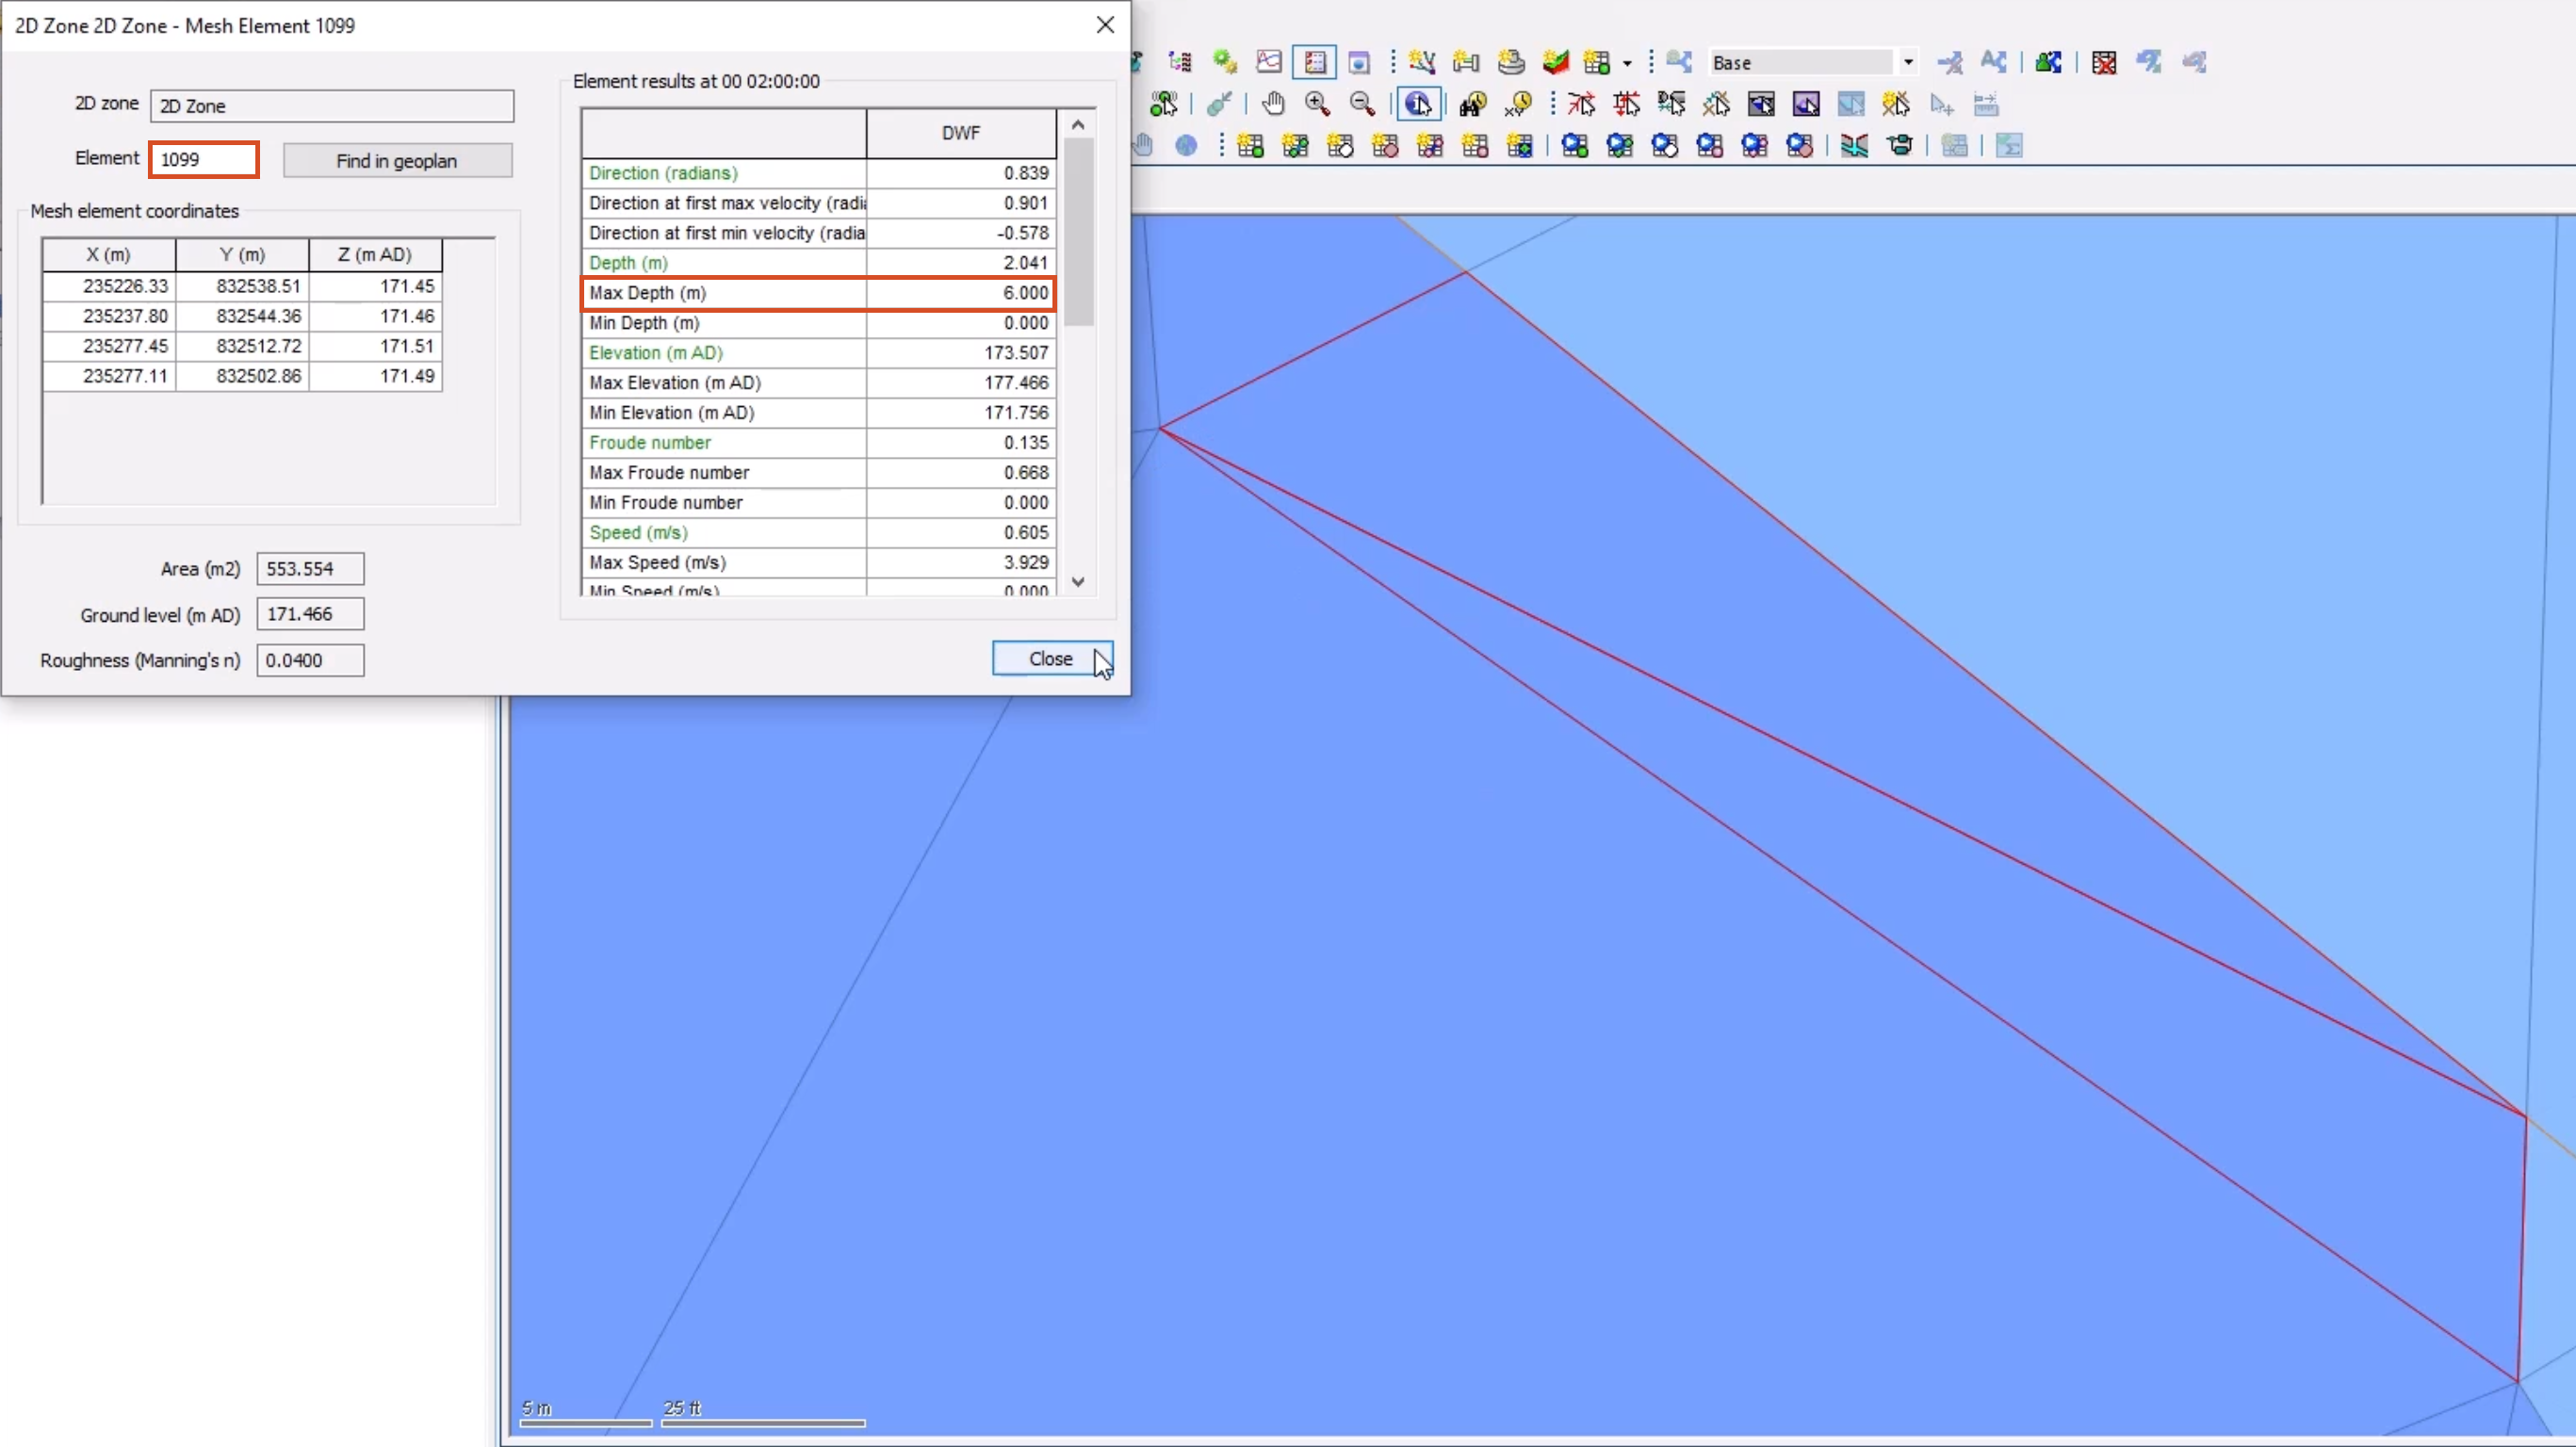
To navigate to a specific element:
- In the Element field, enter an ID, such as “1099”.
- Select the Find in GeoPlan button.
Notice the Max Depth (m) is recorded as 6, the height at which the base linear structure 2d is set to be fully removed.
- Select Close.
To graph the results:
- In the Results toolbar, click Graph Pick.
- Pick an element upstream of the base linear structure 2d.
- In the Graph dialog box, in the Attributes list, select Depth (m) [depth2d].
- Click OK.
A graph displays the depth of water building at the structure, and then rapidly decreasing after it is removed.
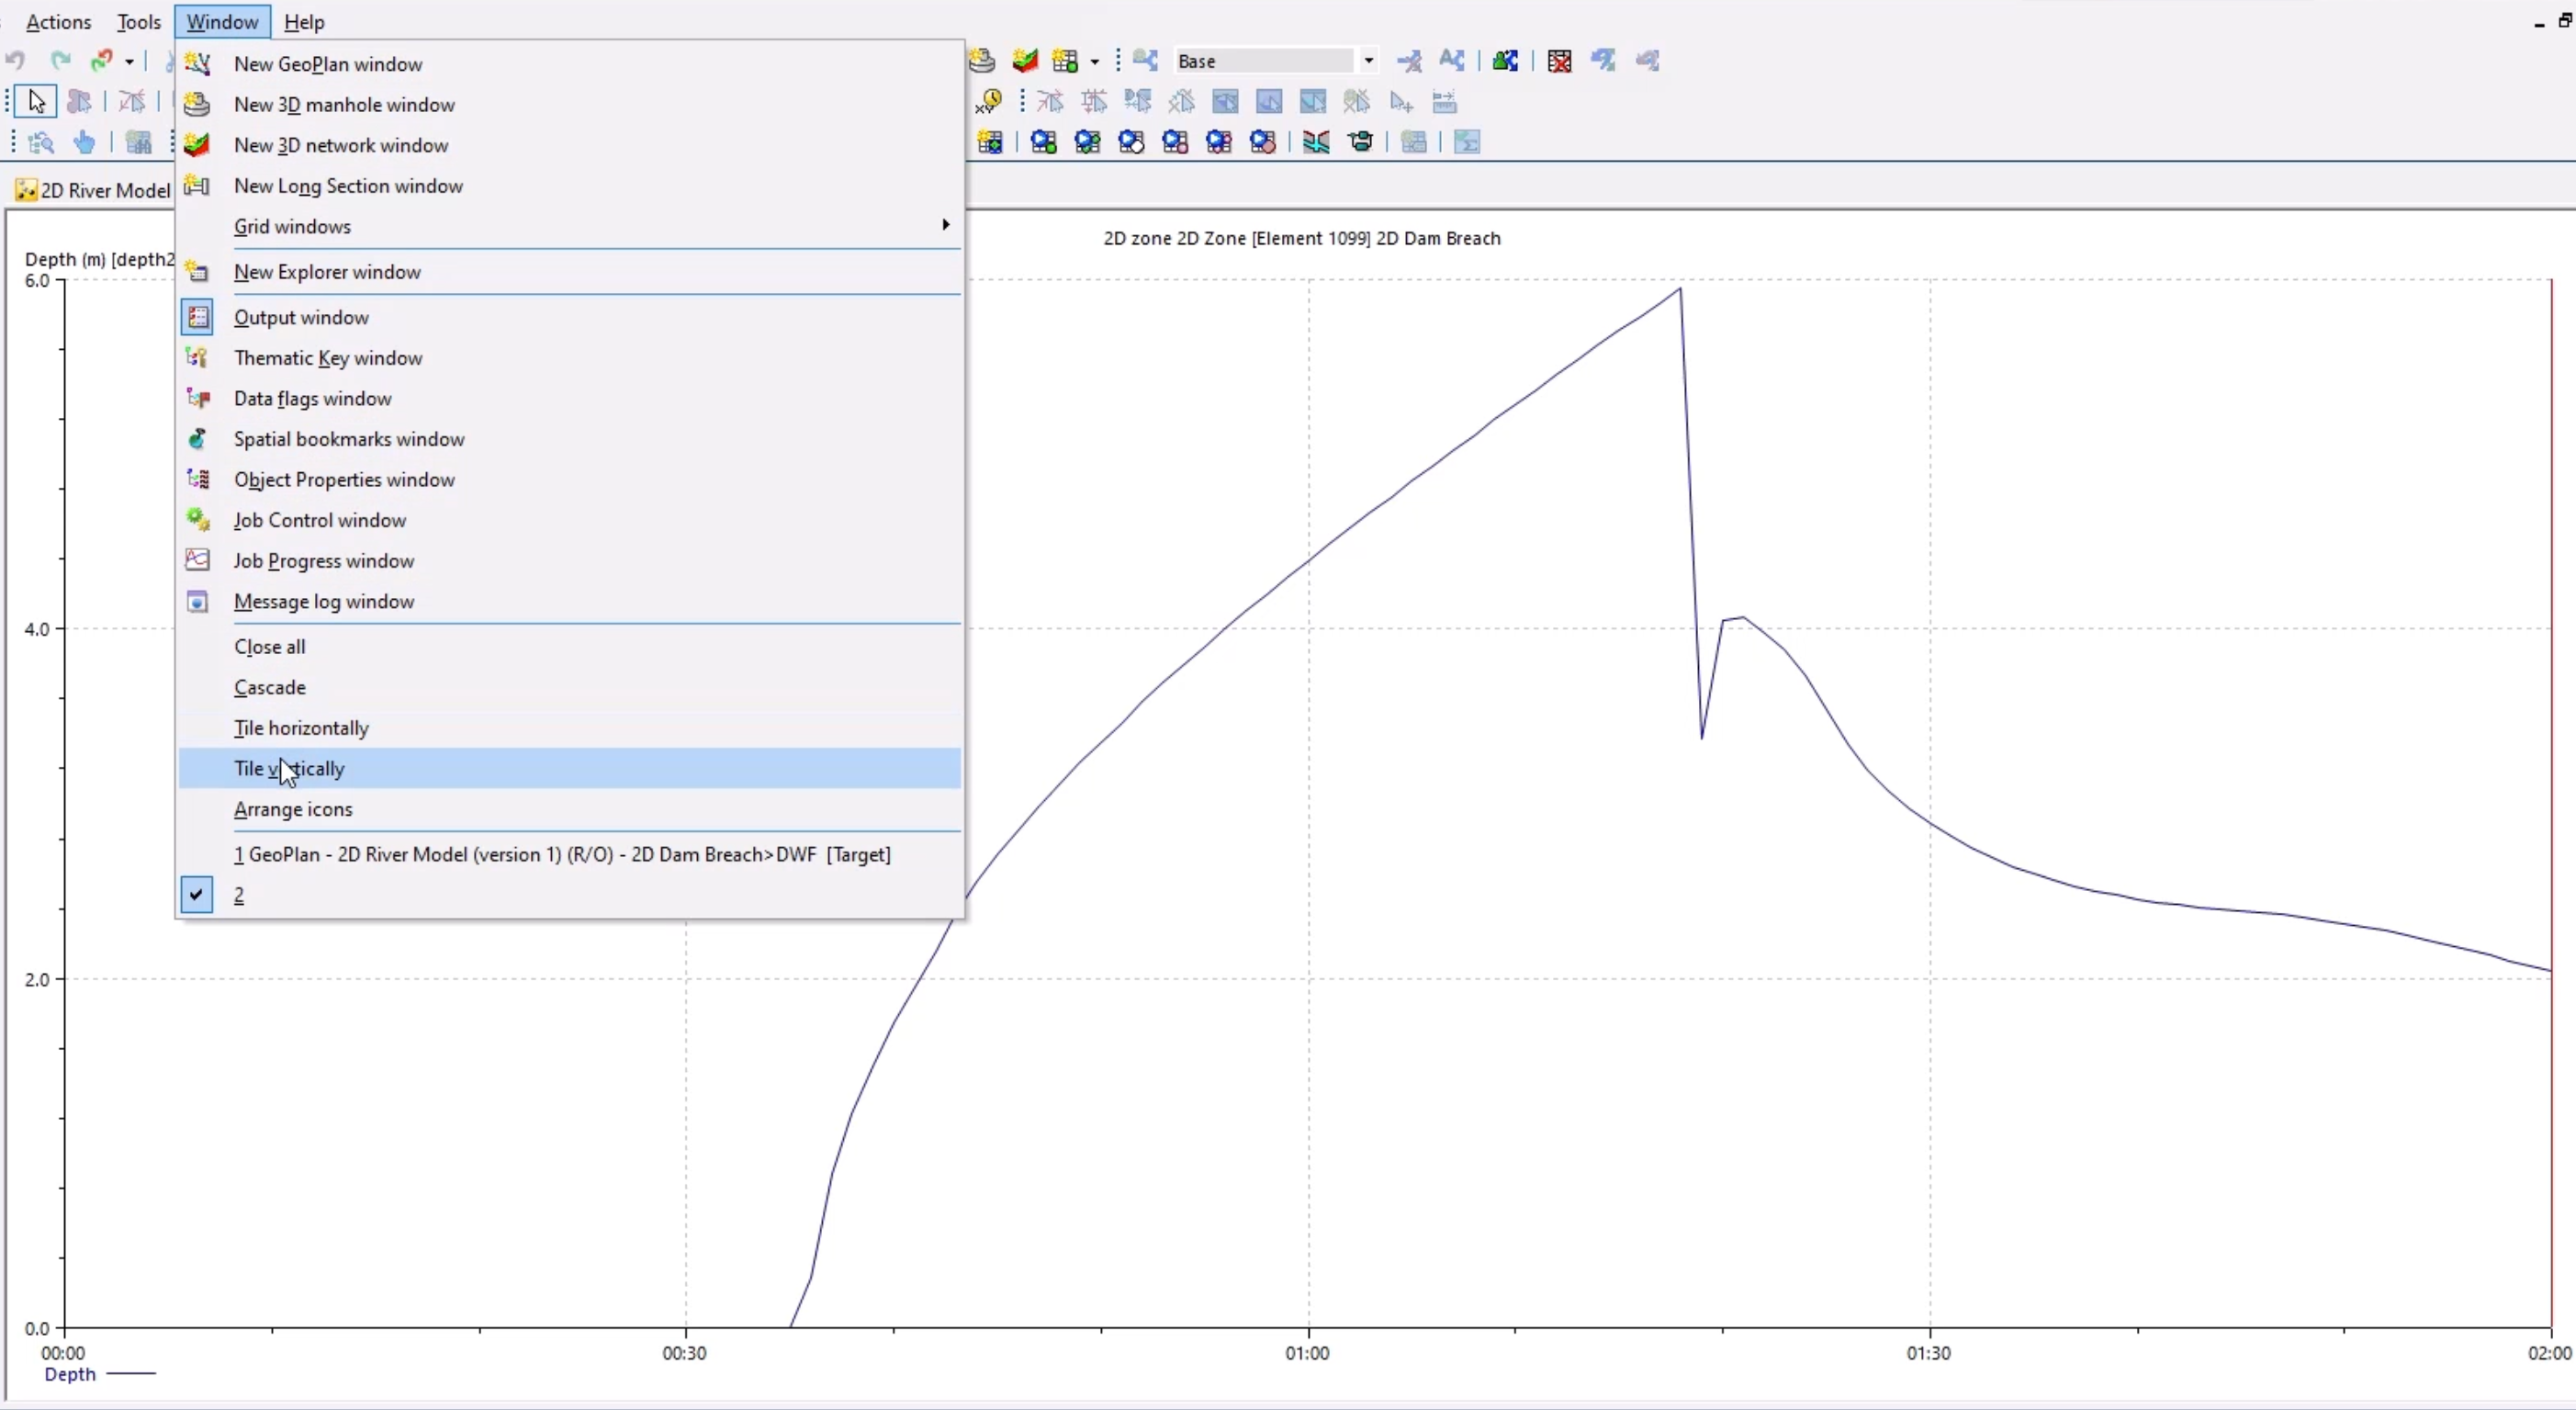
To display the graph and GeoPlan side by side:
- With the graph window tabbed, select Window > Tile Vertically.
- In the GeoPlan window, zoom out for a better view.
- On the graph, drag the red line to move to that point in the simulation.
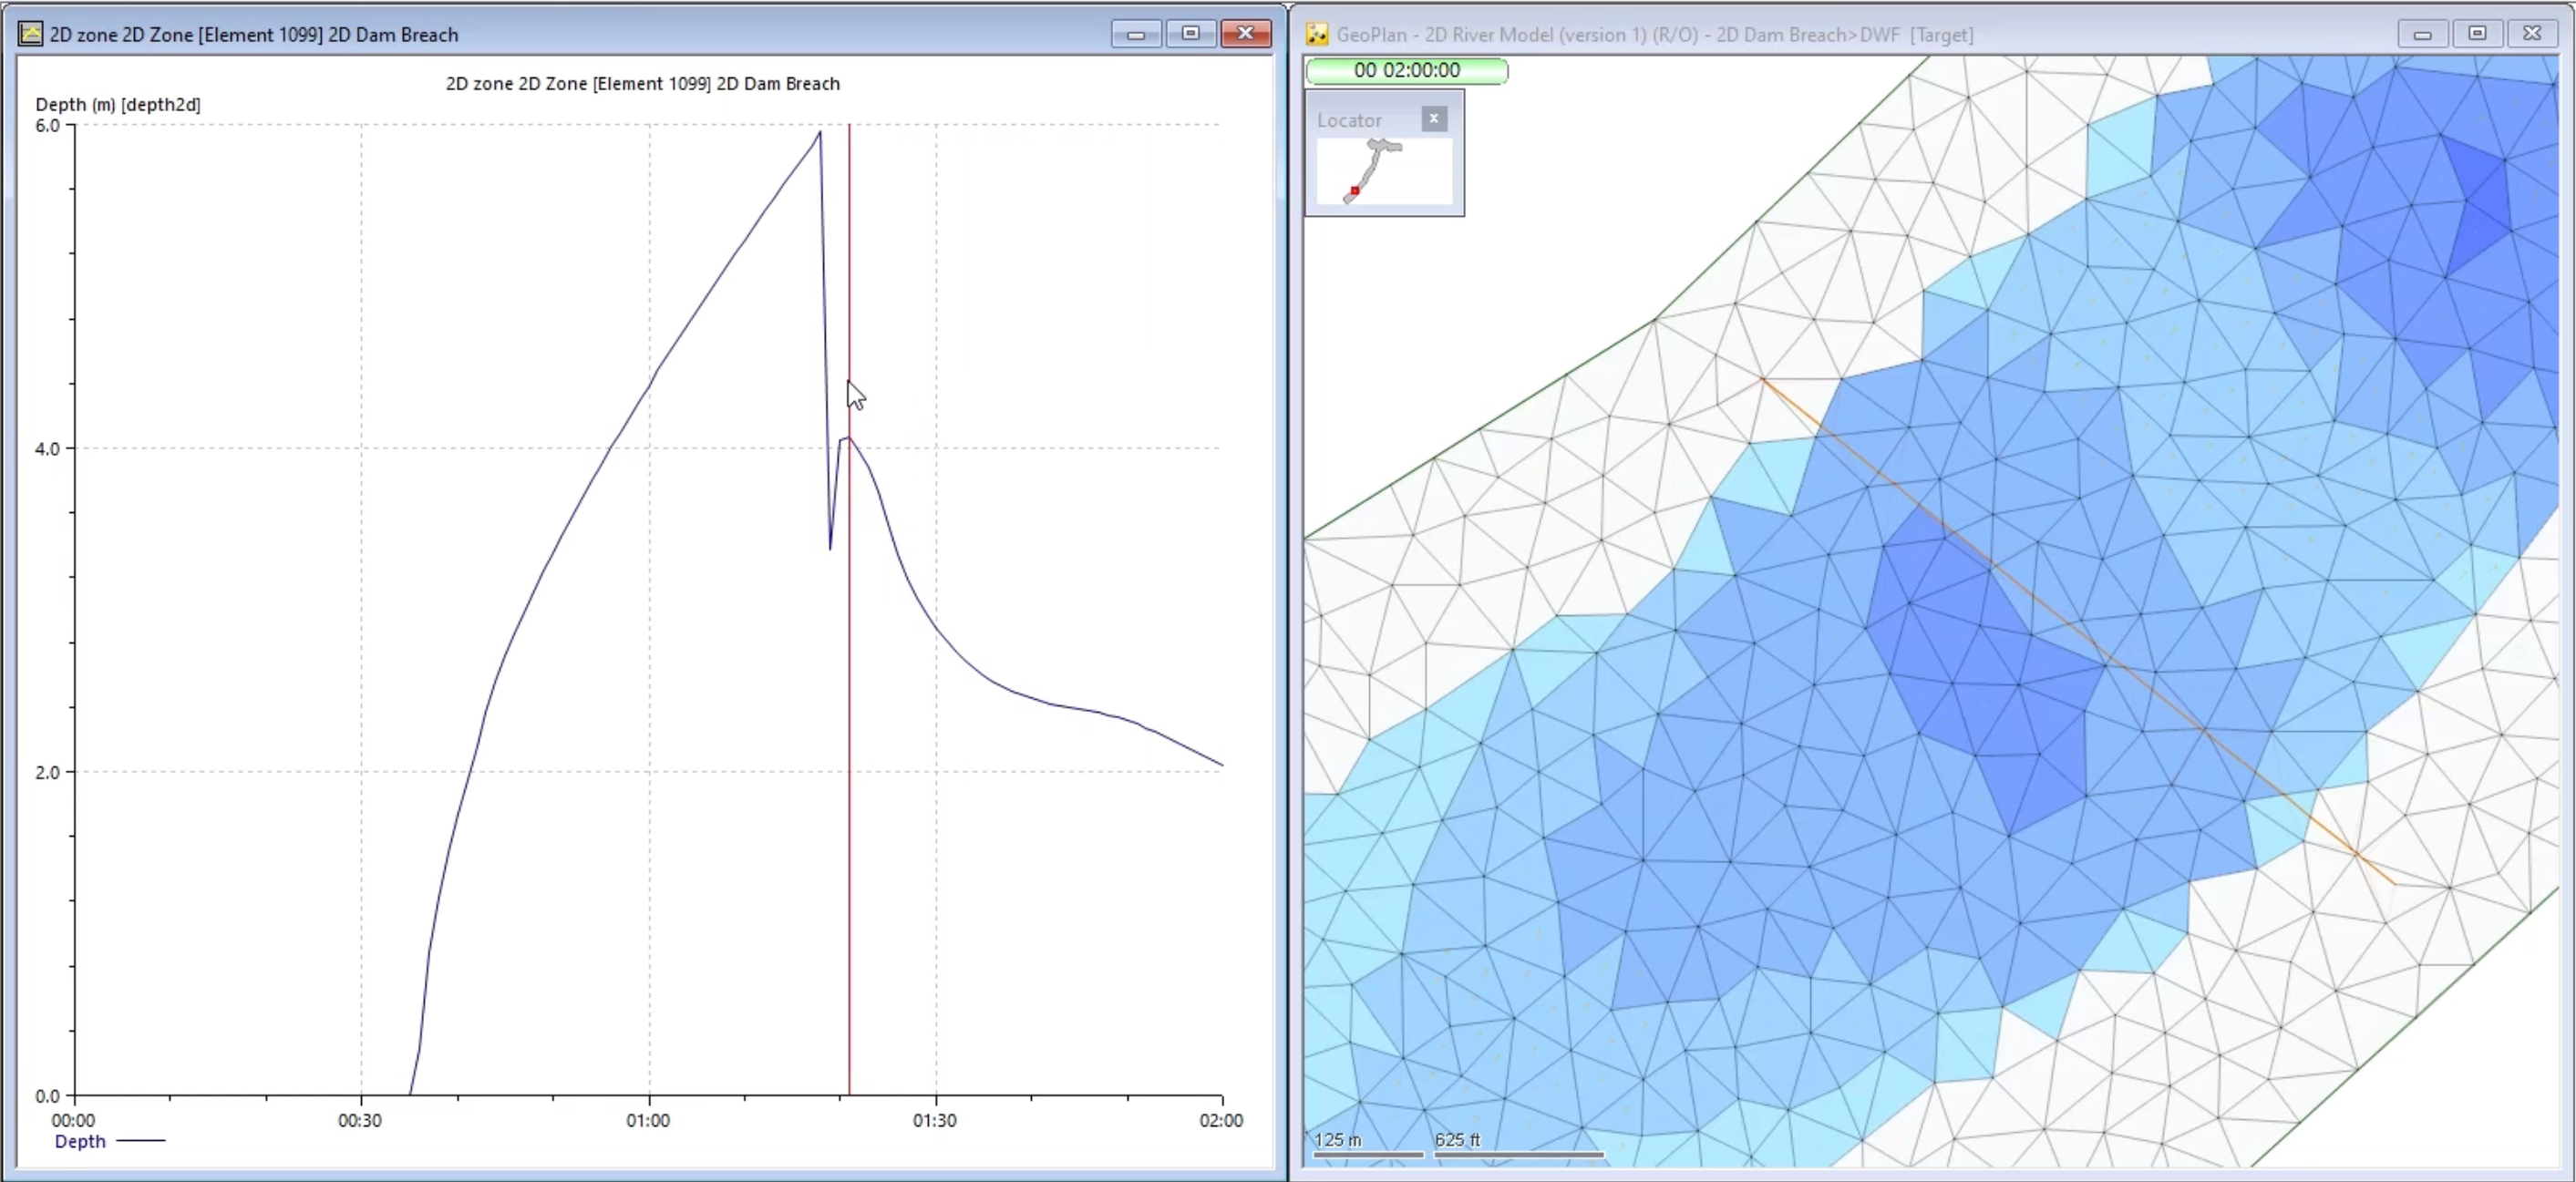
- In the Replay Control toolbar, click Rewind.
- Click Play.
As the simulation plays, the GeoPlan updates, and the red line progresses through the graph. The graph will not reach 6 meters, as this point occurs between results timesteps.