Running an integrated 1D model
Run a simulation on a fully integrated model.
Tutorial resources
These downloadable resources will be used to complete this tutorial:
Step-by-step guide
Separate river and urban drainage networks are connected to create an integrated model. Flow can transfer between the urban drainage network and the river channel via created connection points, and a simulation can now be run on the fully integrated model.
- Open the transportable database .icmt file for this tutorial.
- In the transportable database window, right-click the top-level folder and select Copy.
- In the Model Group window, right-click the Database and select Paste.
When running an integrated model, consideration should be given to the event files being used, as the hydrology is more complex.
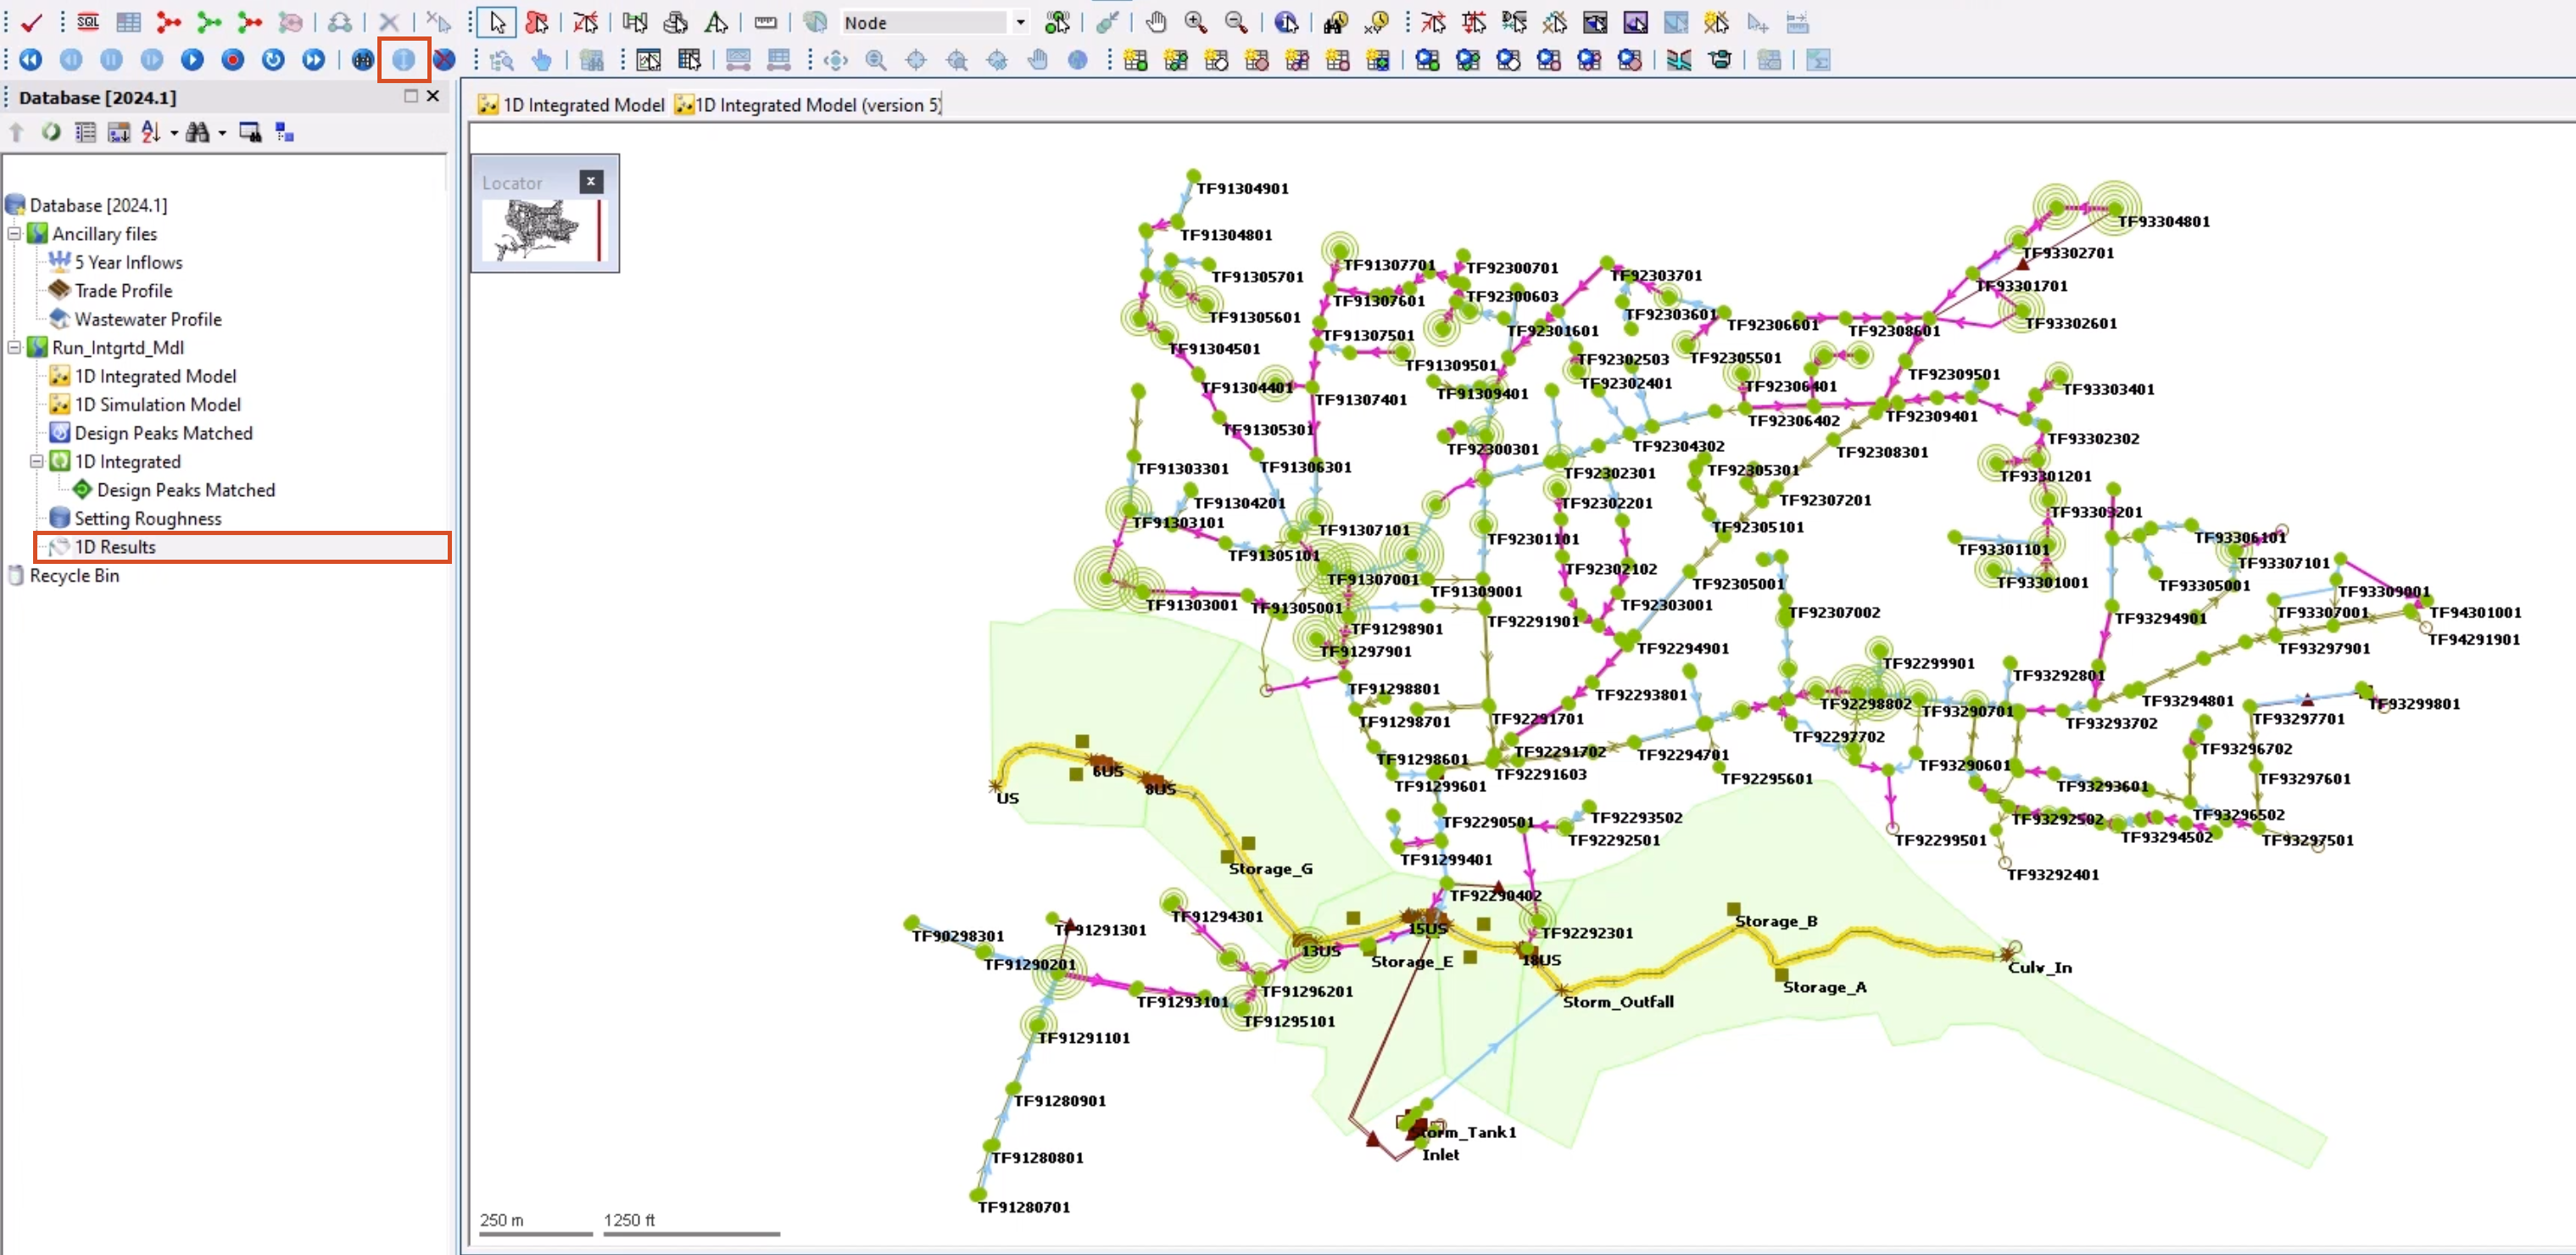
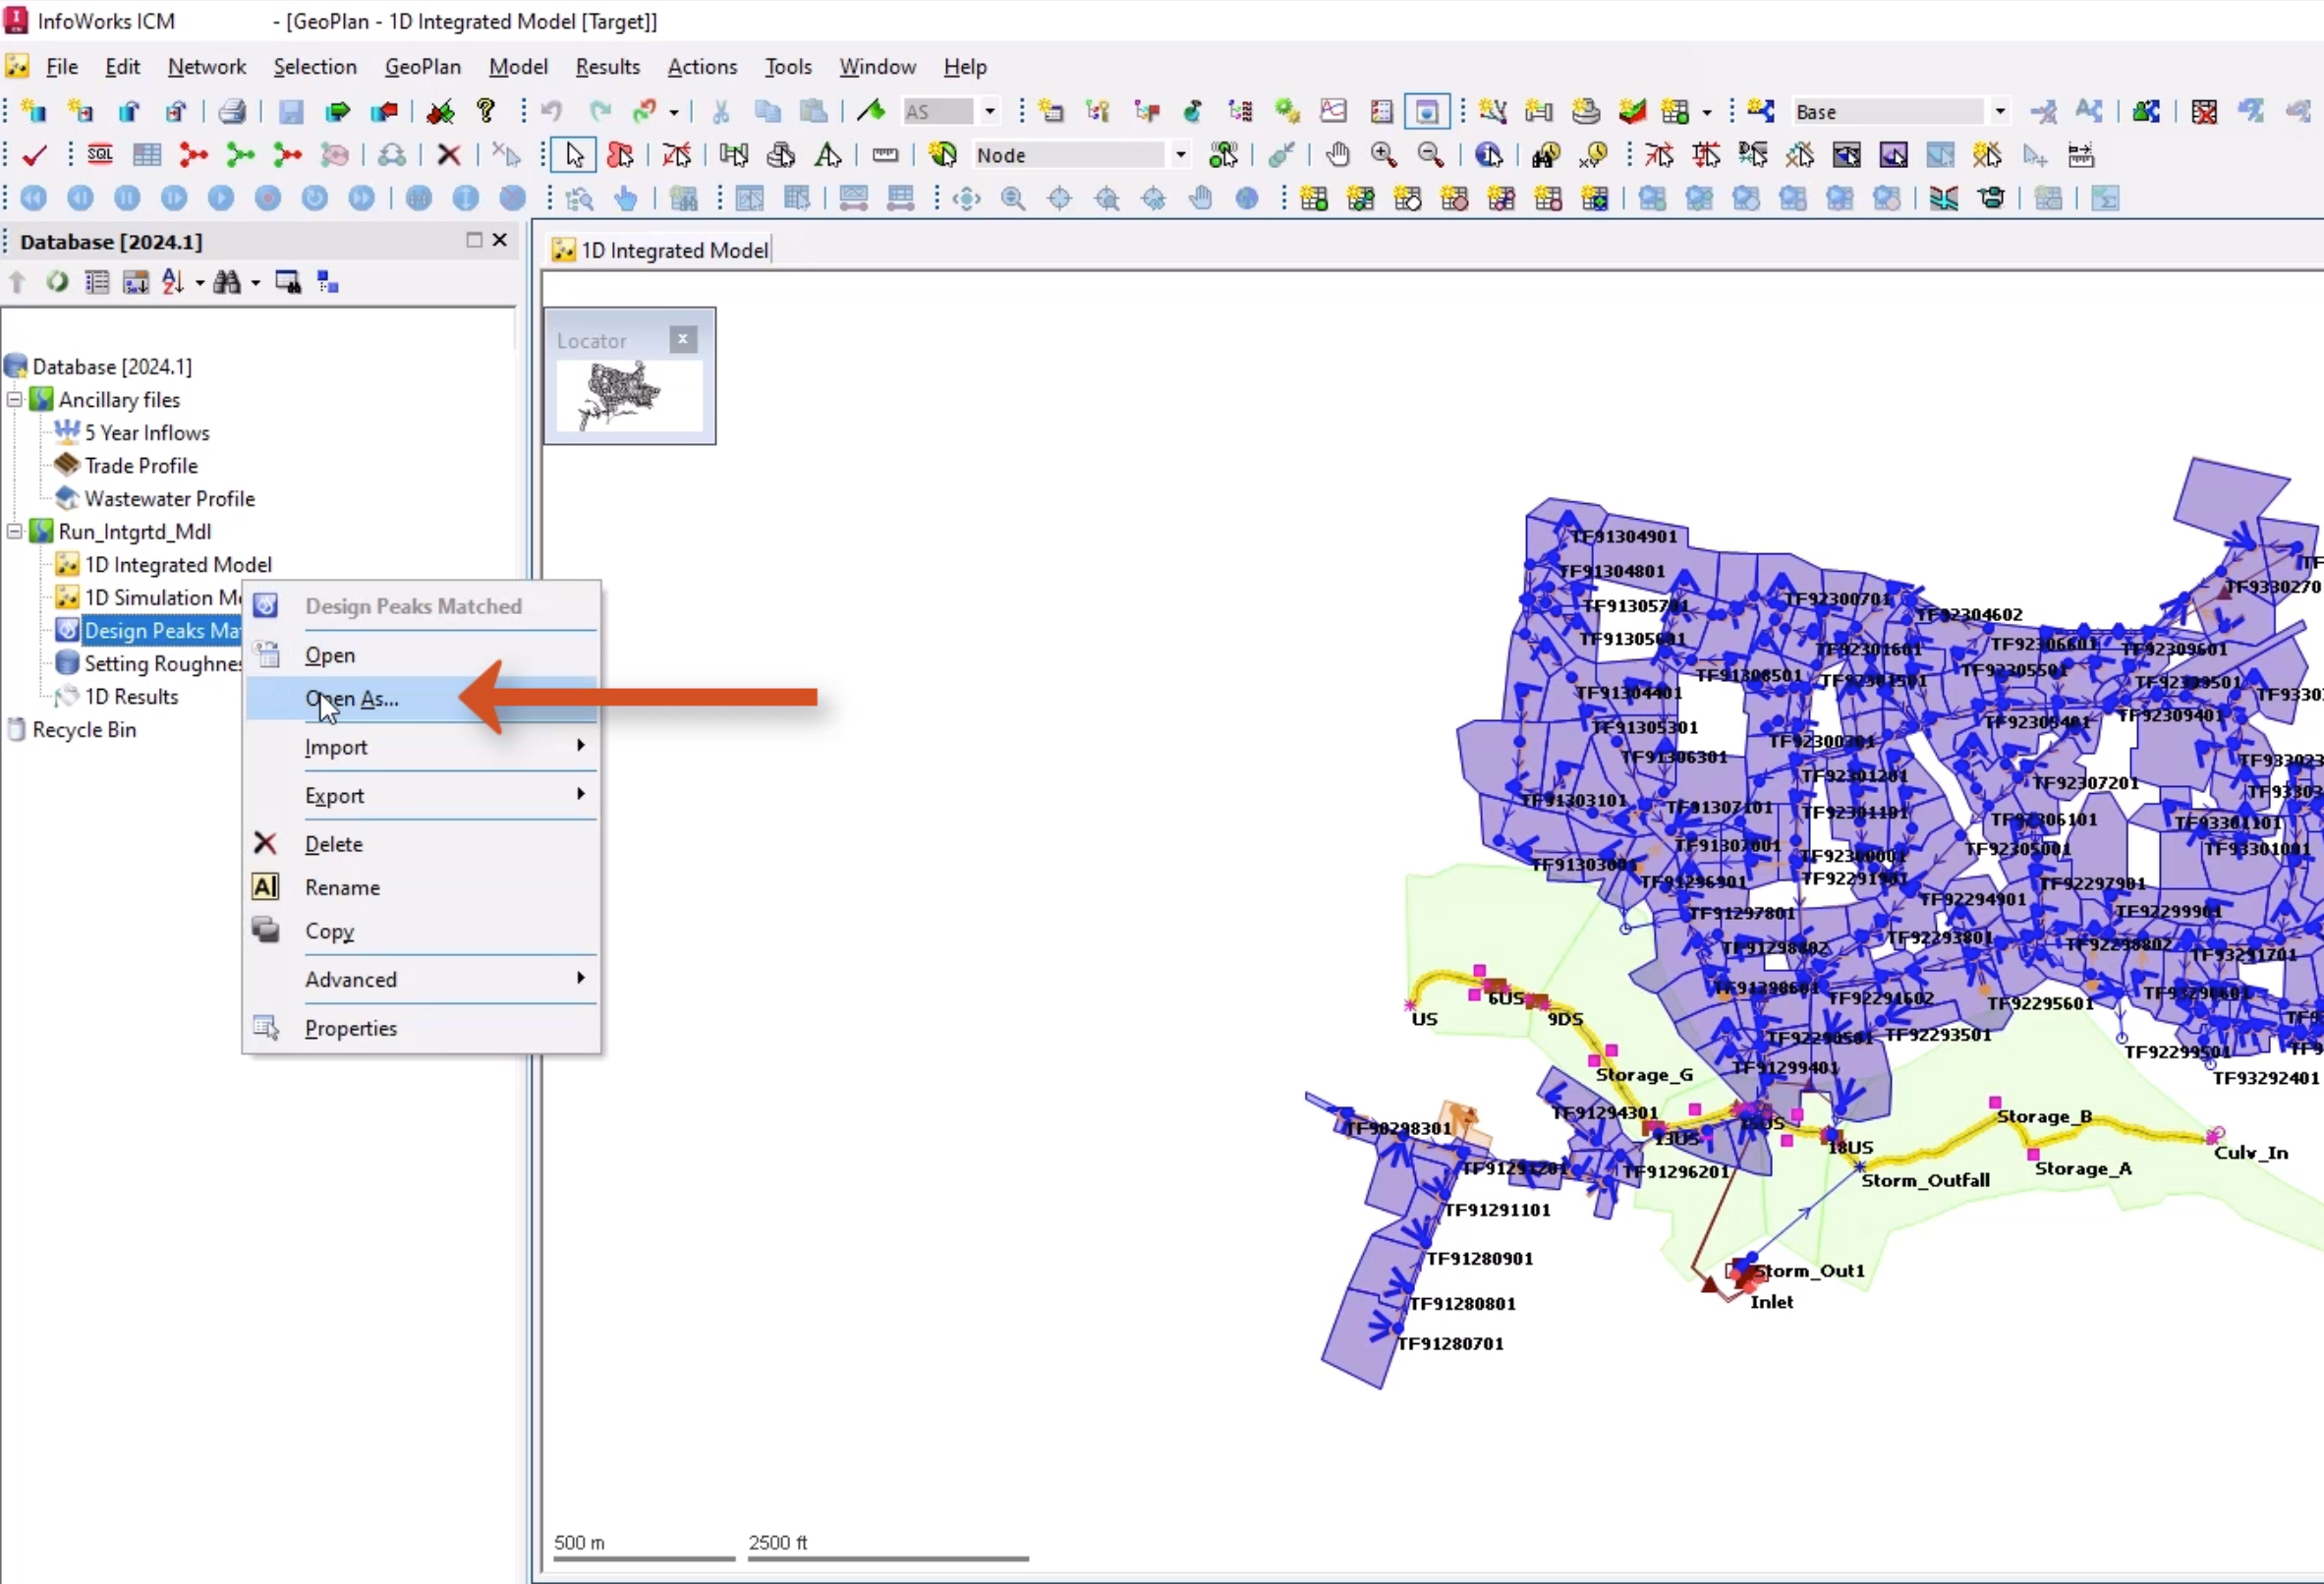
- From the Database, right-click the Design Peaks Matched rainfall event and select Open as.
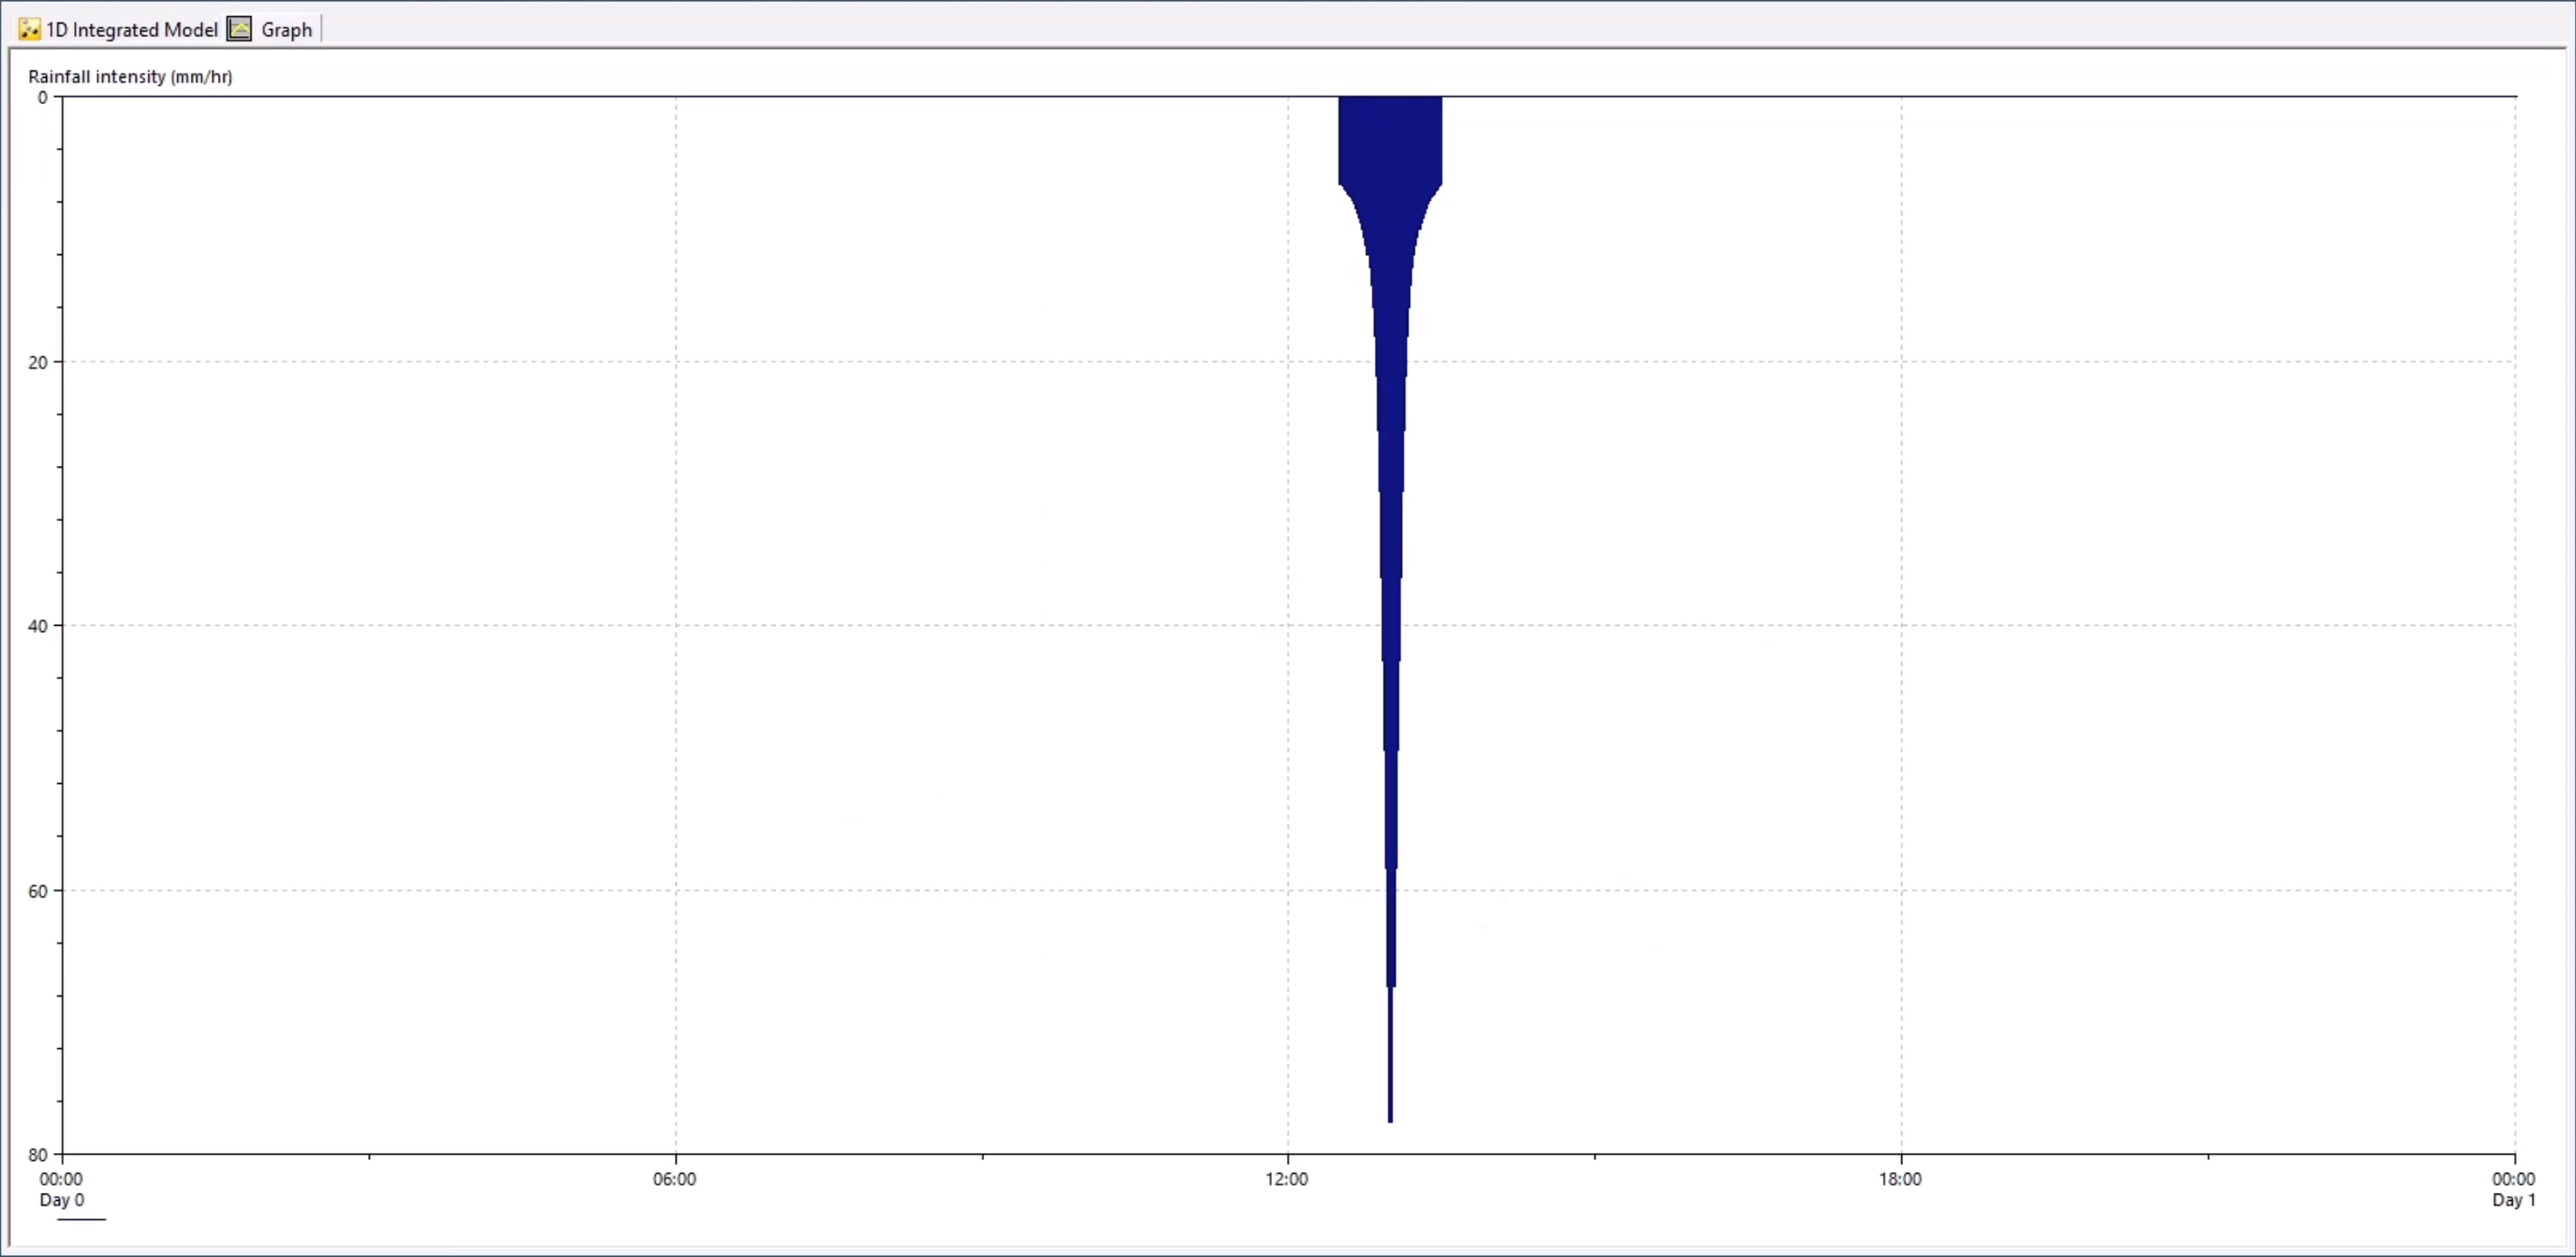
- In the Select Format dialog box, select Graph.
- Click OK.
This rainfall event is shifted, so that the peak rainfall occurs at the same time as the inflow file.
- Close the graph window.
Now, set up the simulation:
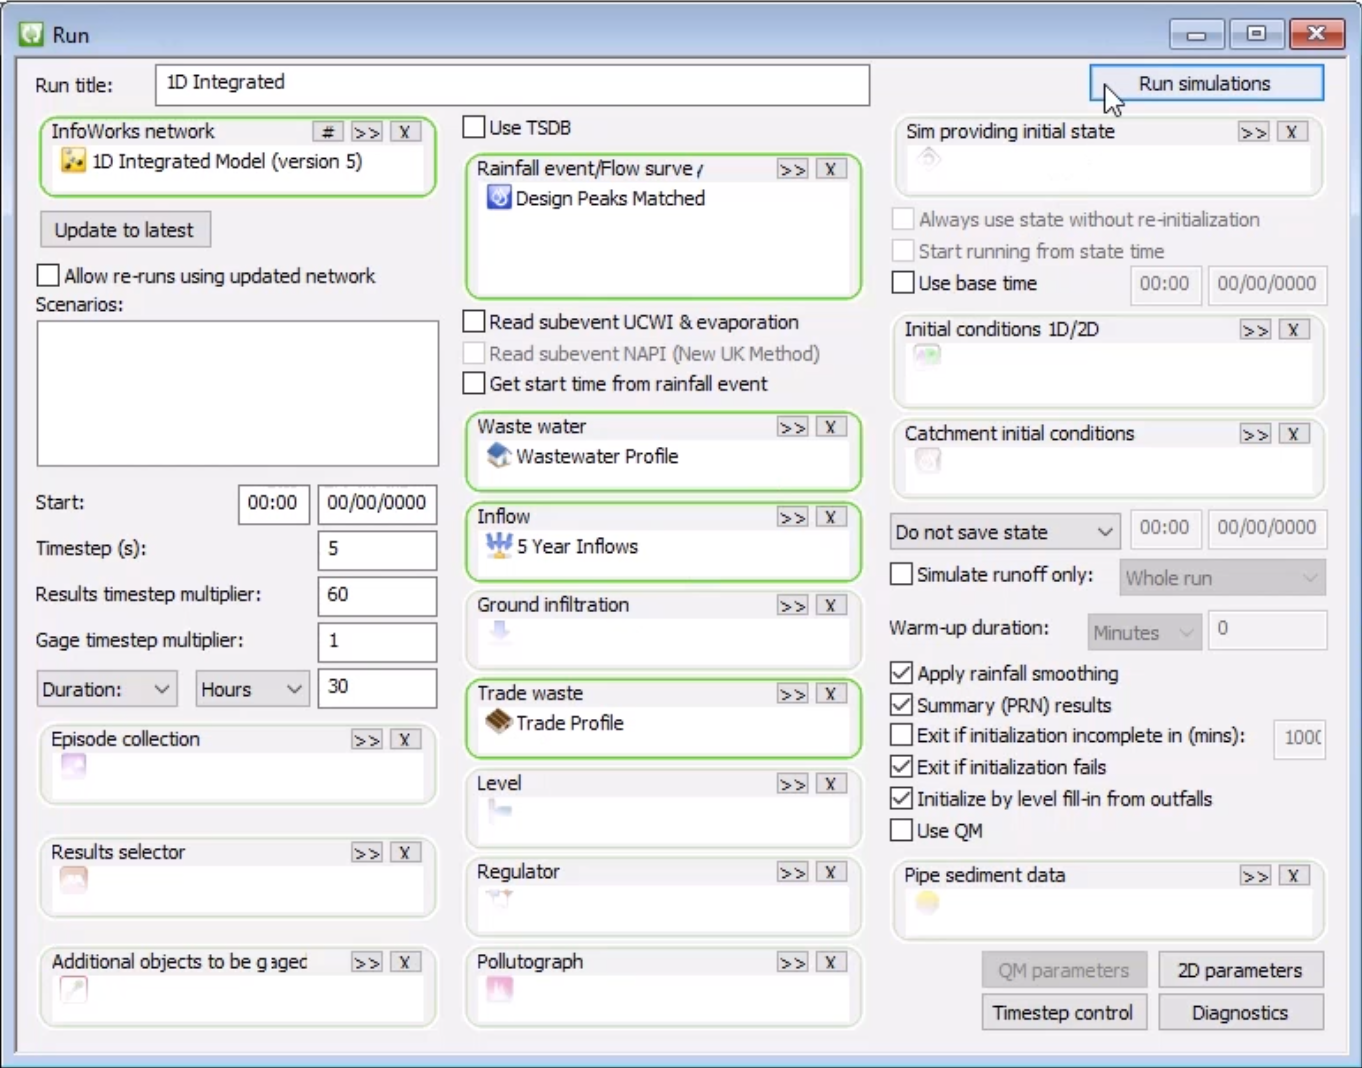
- From the Database, right-click the Model group and select New InfoWorks > Run.
- In the Run dialog box, add a Run title of “1D Integrated”.
- From the Database, drag the 1D Integrated Model into the Run dialog box and drop it into the InfoWorks network box.
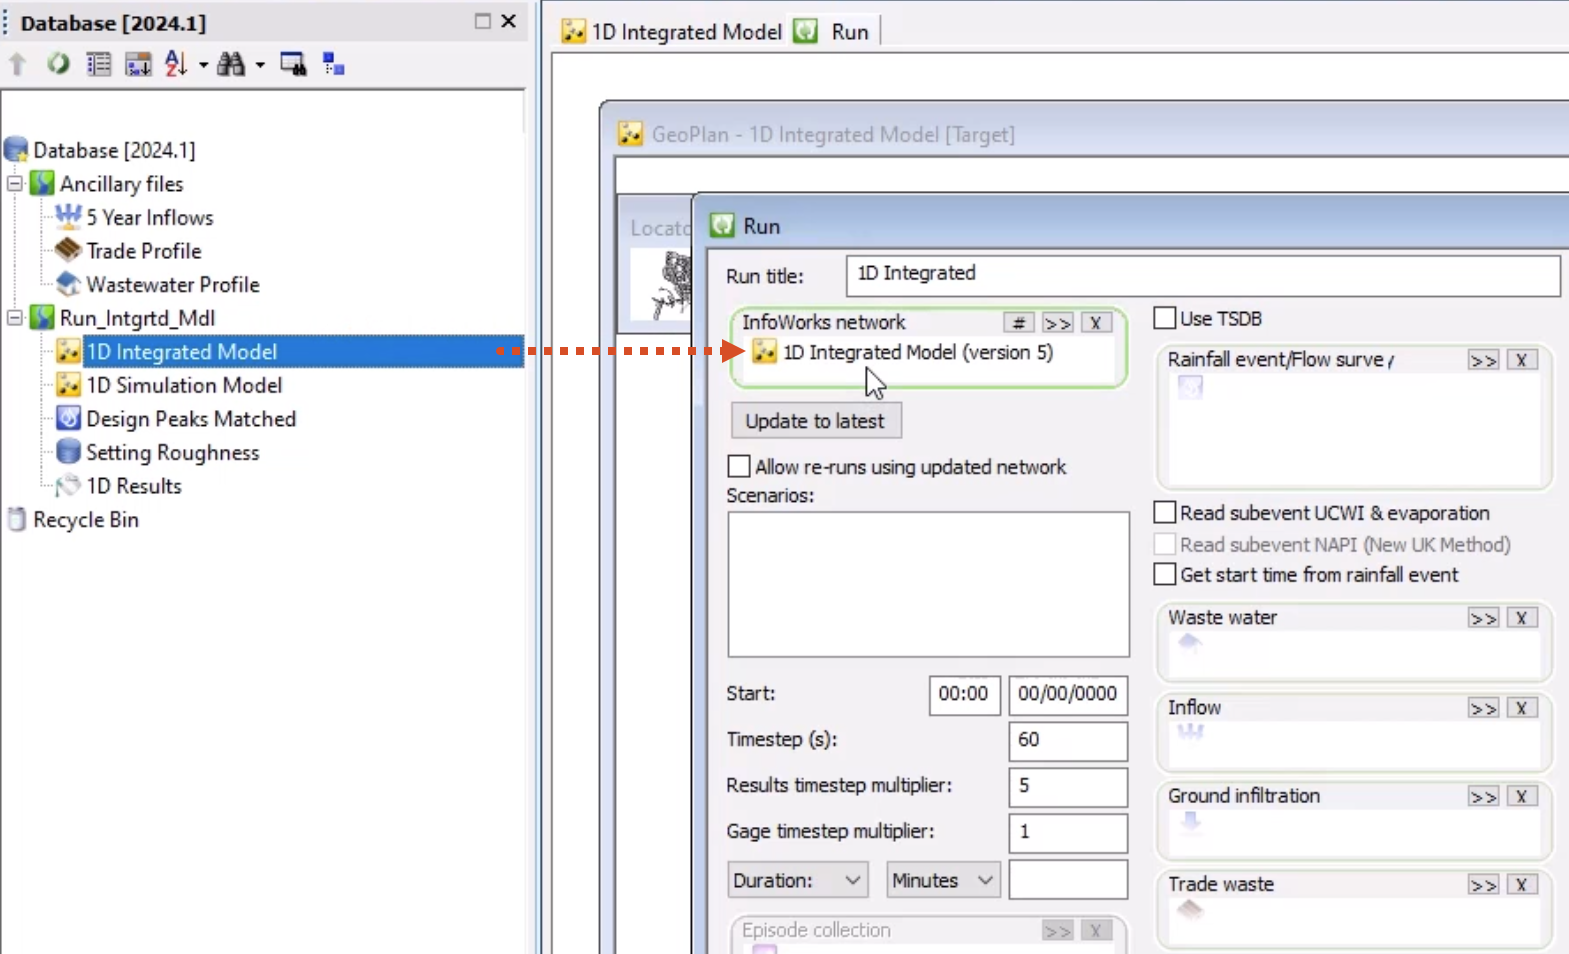
- Set the Timestep(s) to a more appropriate value of 5.
- Set the Results timestep multiplier to 60.
- Set the Duration drop-down to Hours and the amount to 30.
- From the Database, drag the Design Peaks Matched event and drop it into the Rainfall Event box.
- From the Database, Ancillary files folder, one at a time, drag the 5 Year Inflows, Trade Profile and Wastewater Profile files and drop them into the corresponding boxes.
- Click Run simulations.
- In the Schedule Job(s) popup, click OK.
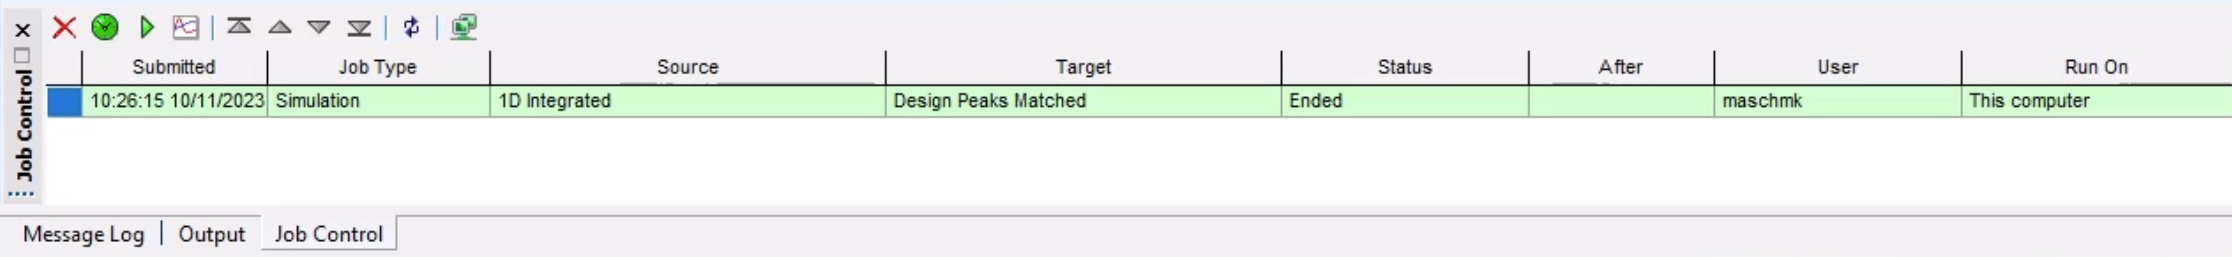
- From the Window menu, select Job control window to display the status of scheduled simulation jobs.
The simulation should complete with no errors or warnings.
- From the Database, expand the 1D Integrated run.
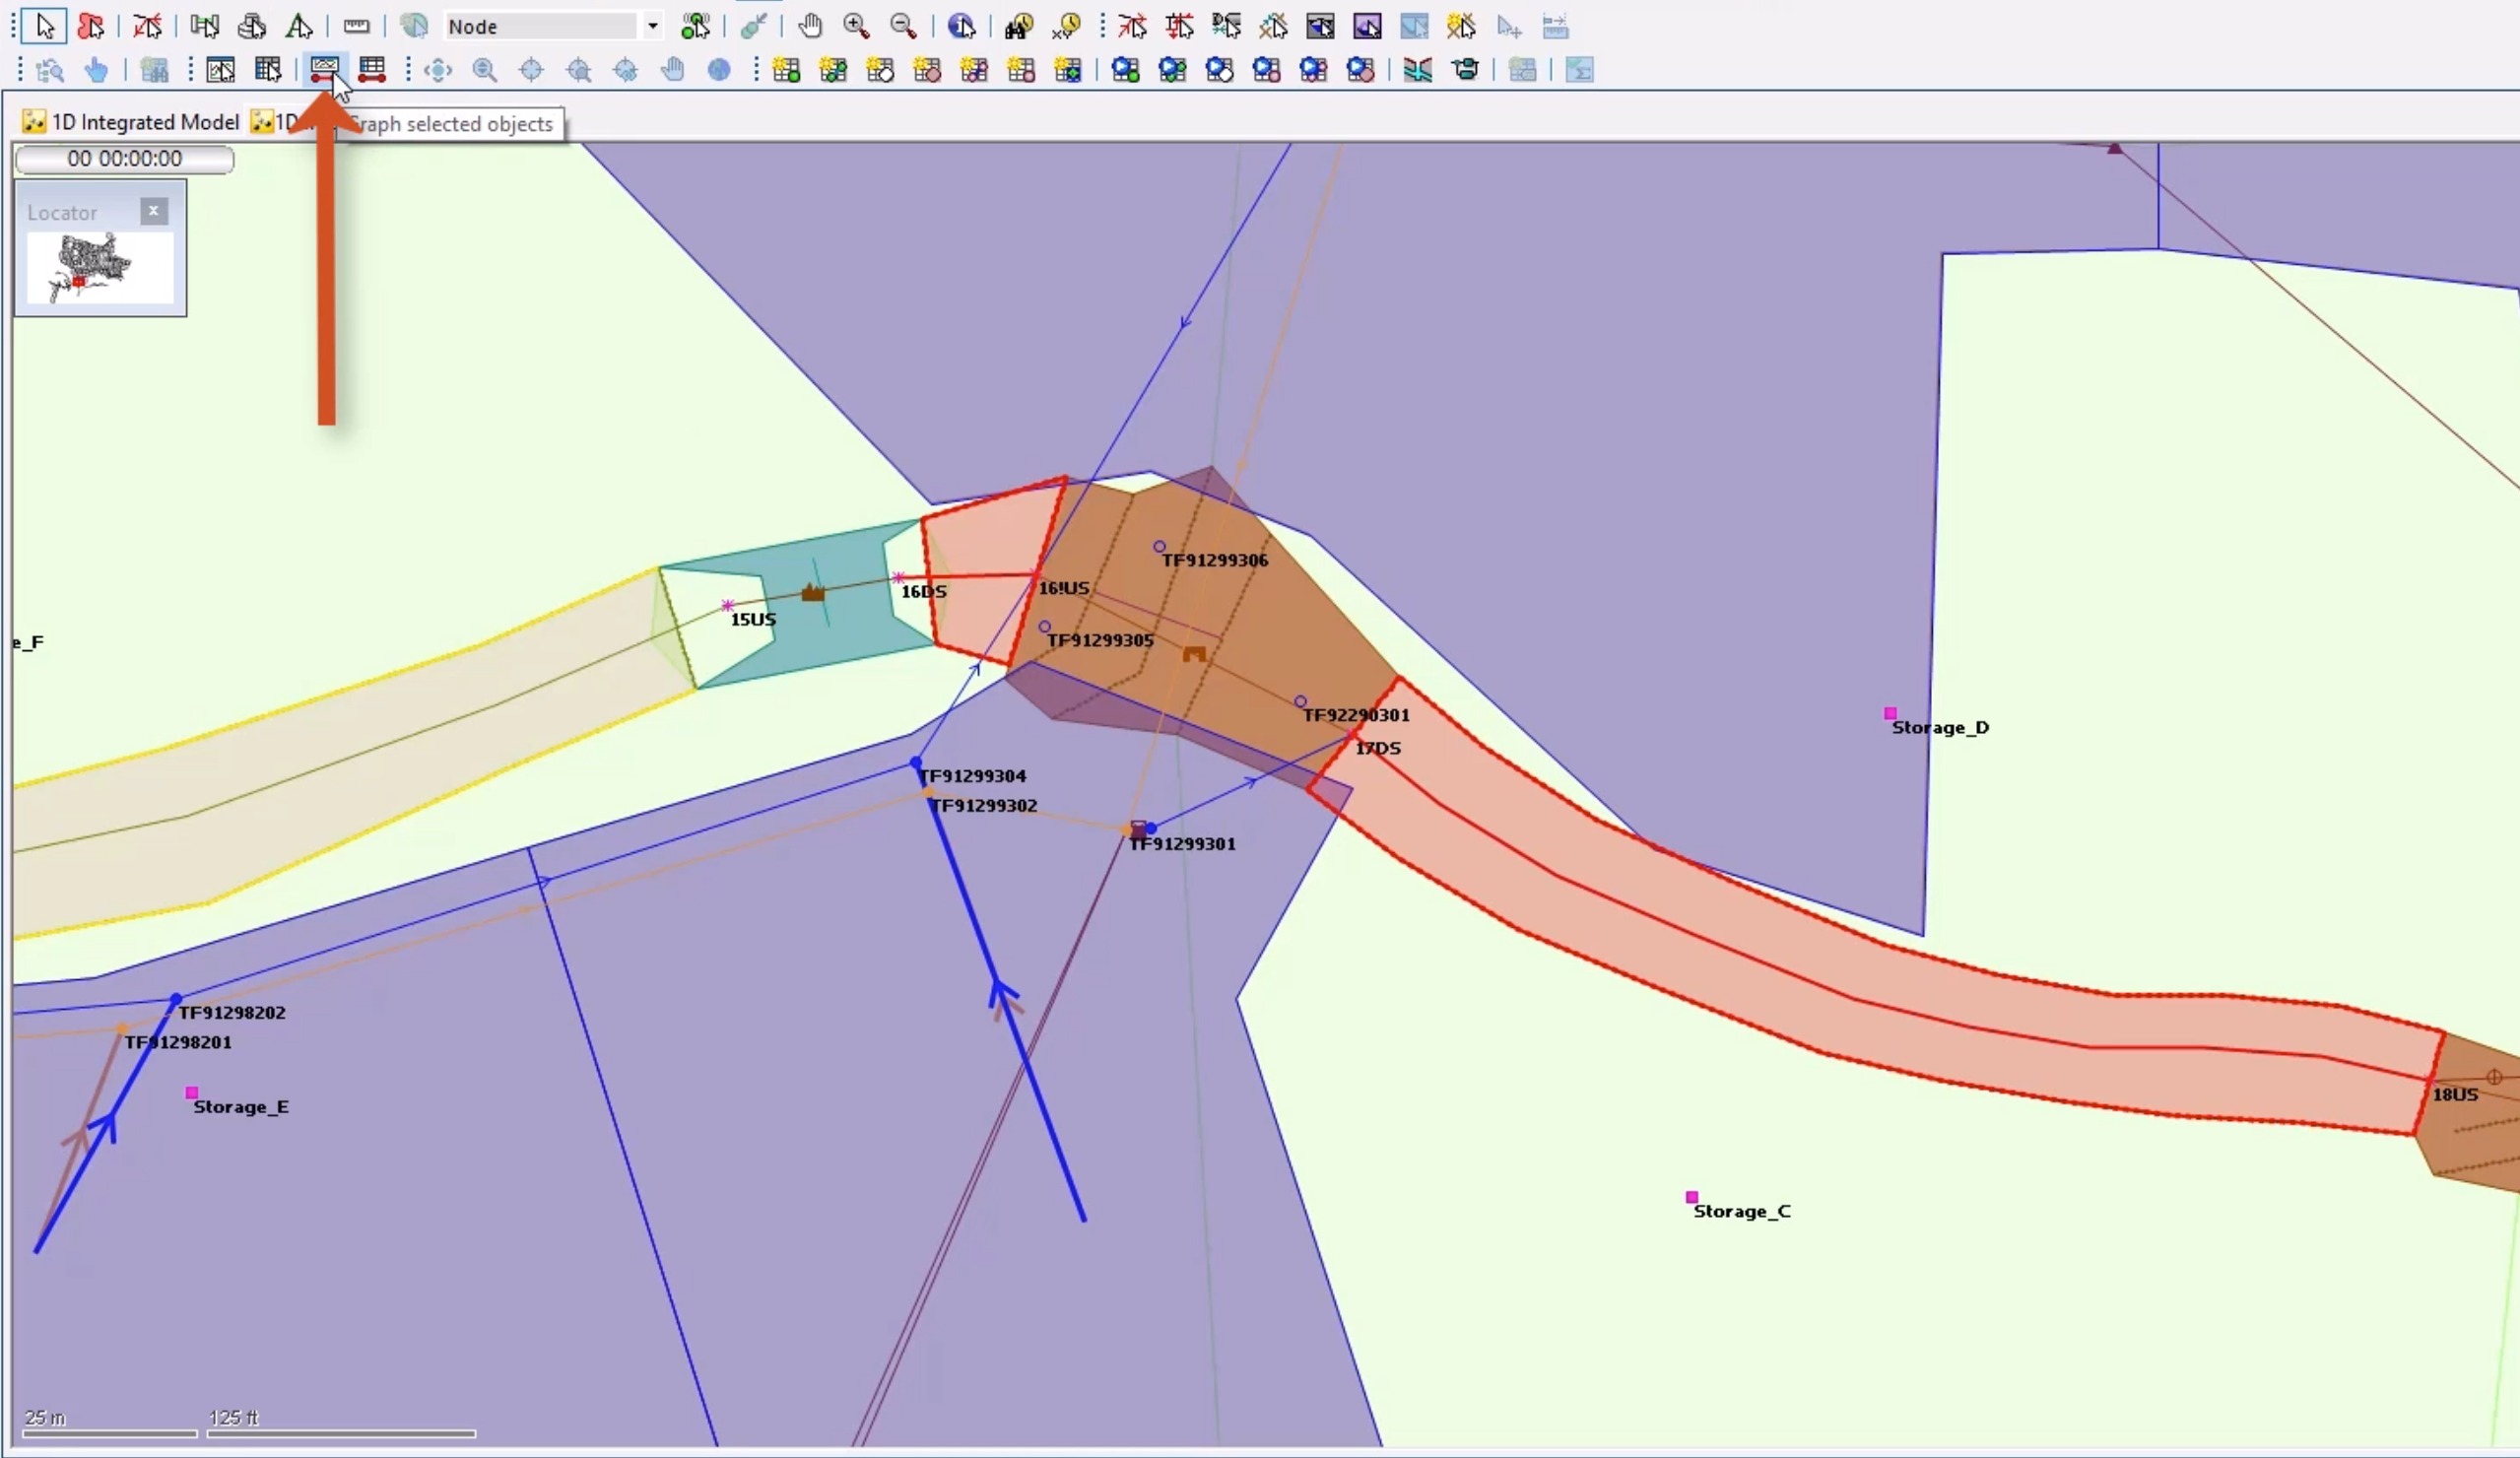
- Double-click the simulation icon to open the results on the GeoPlan.
- Use the Find in GeoPlan tool to locate river reach links 16DS.1 and 17DS.1.
- With the Select tool activated, press and hold CTRL to select both links.
- From the Results toolbar, click Graph Selected Objects.
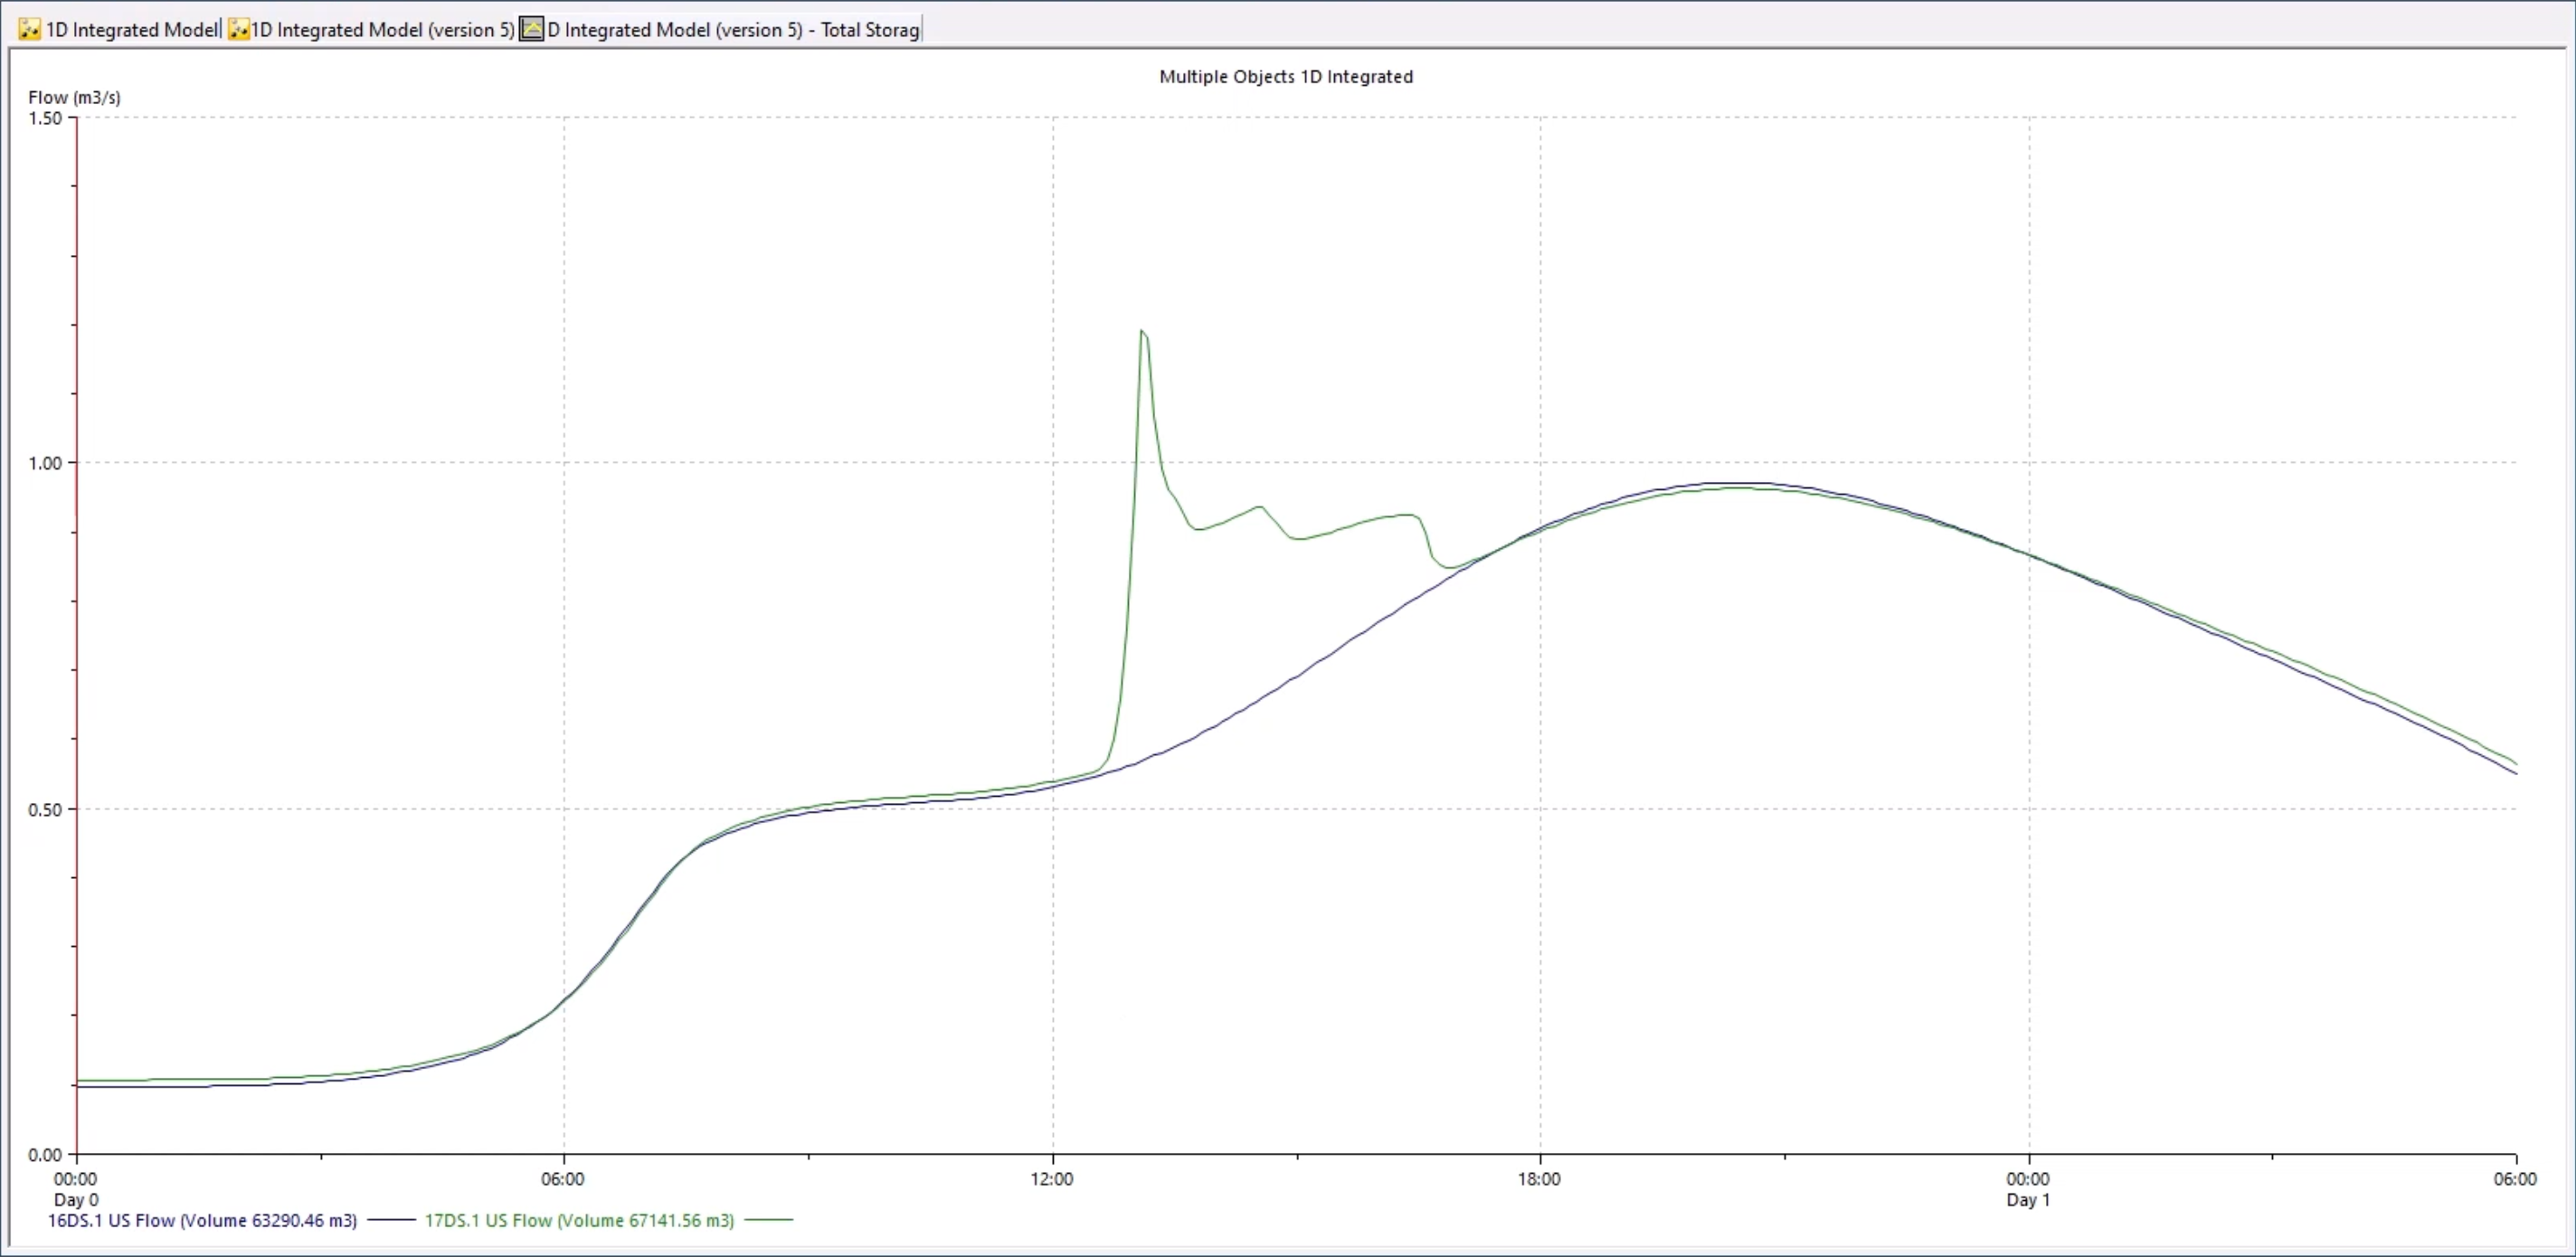
- In the Graph Selection popup, select the Flow attribute.
- Click OK.
The graph displays the sewer inflows into the river where connections are made to create the integrated model.
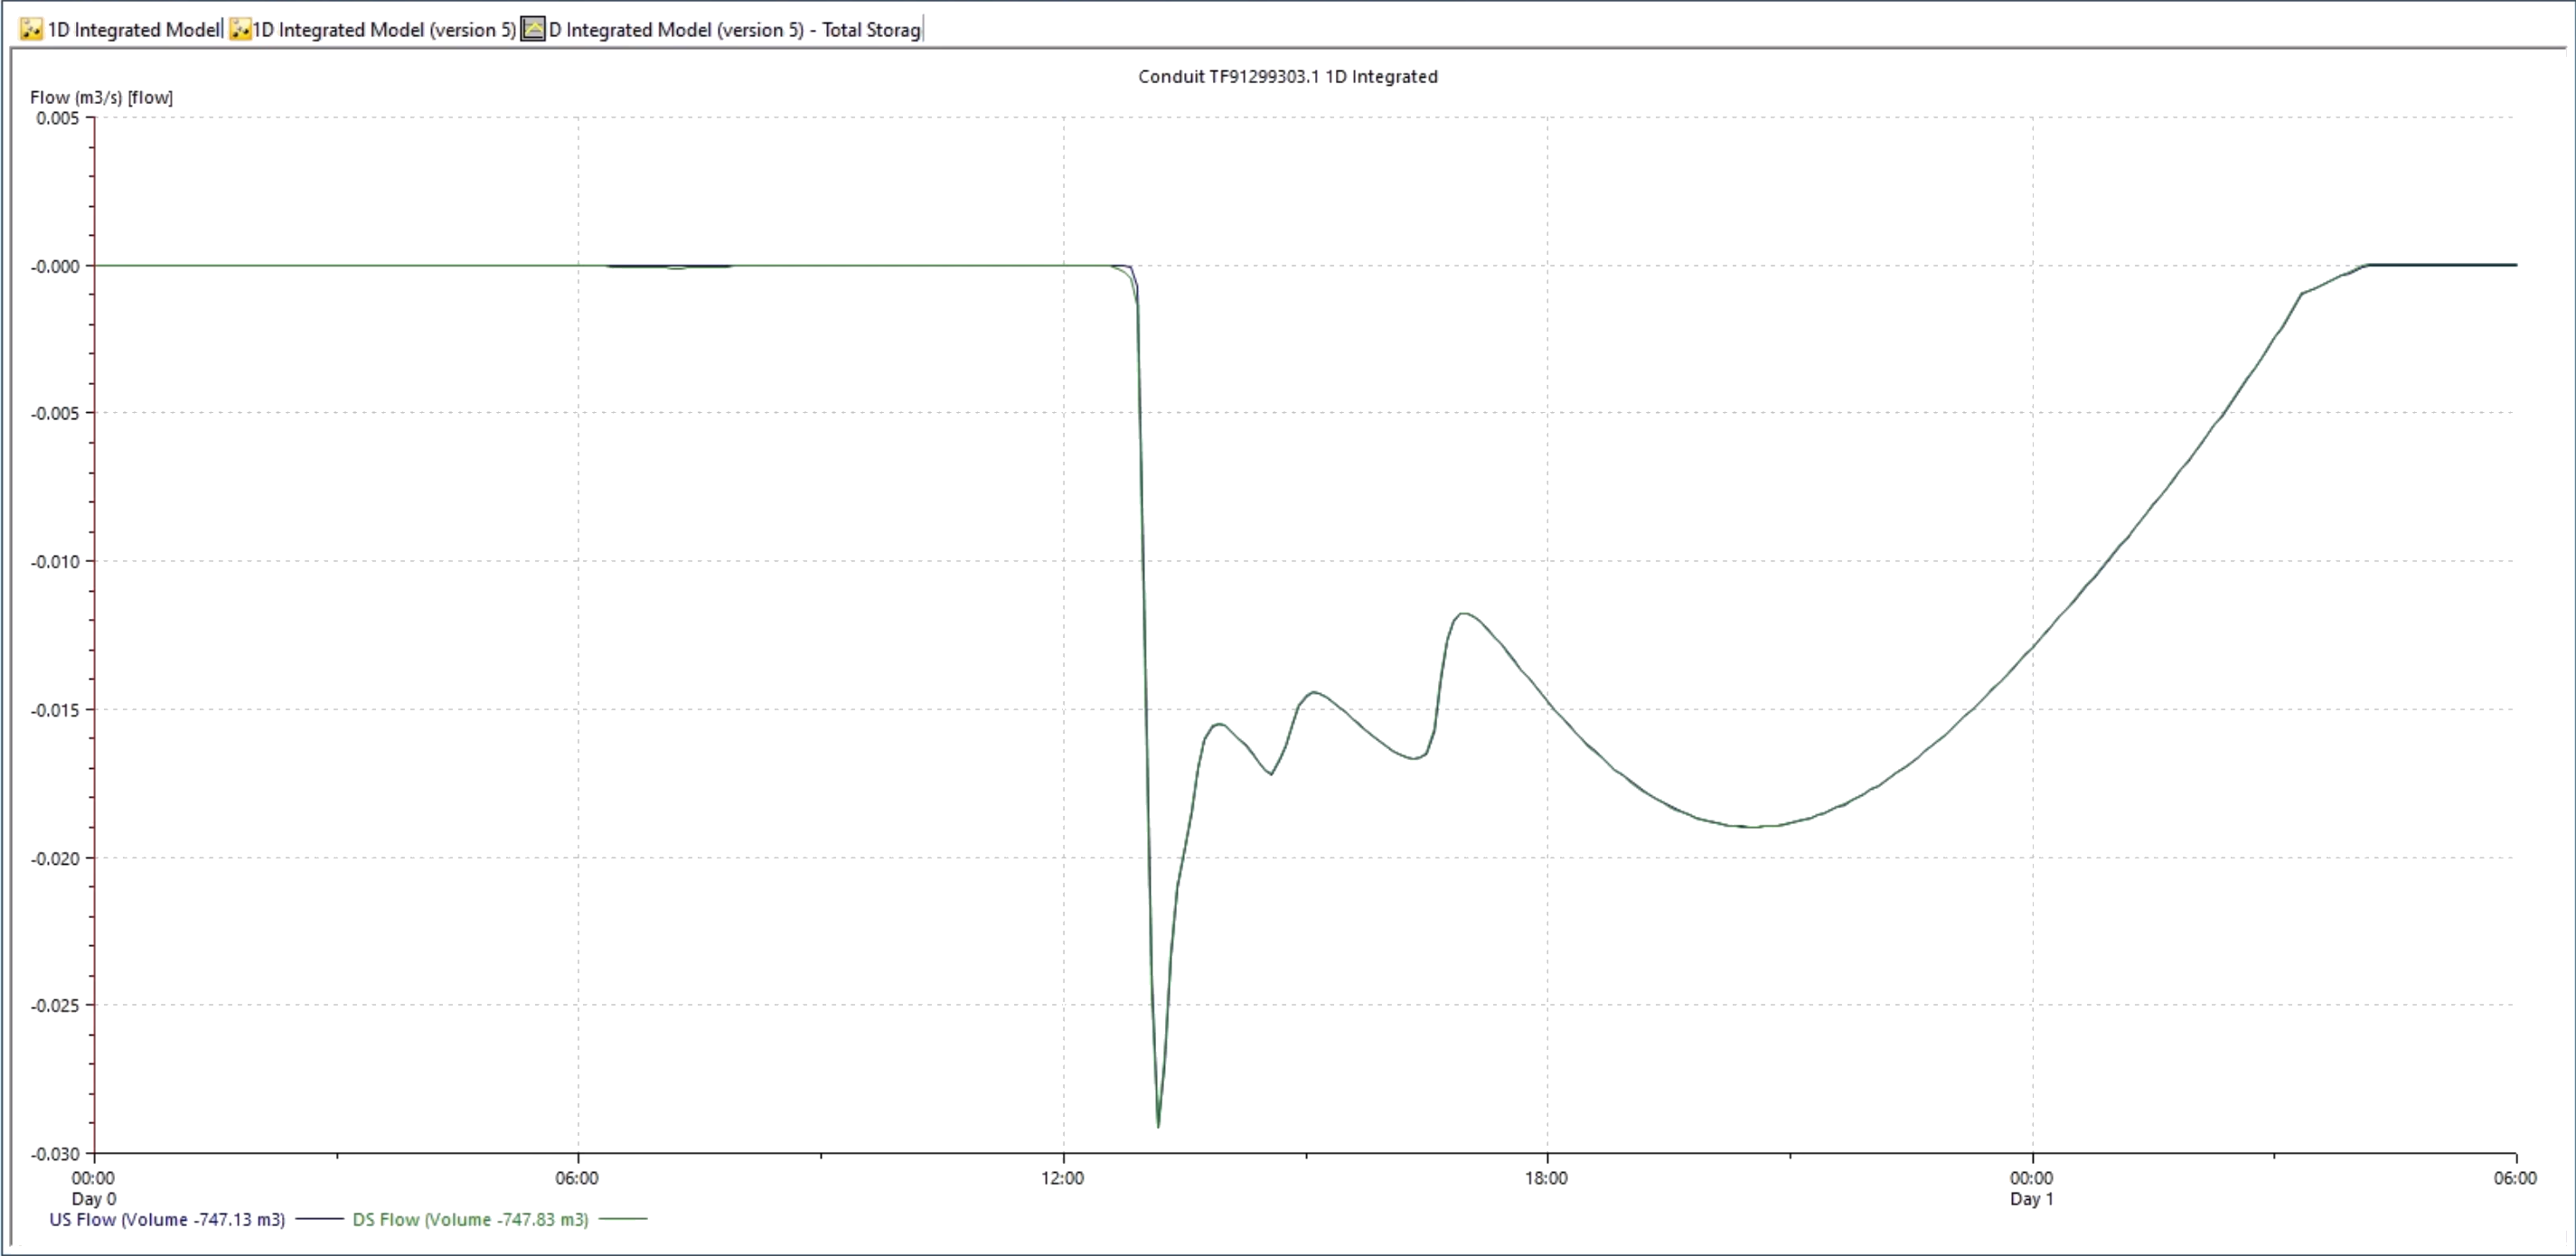
- Use the Find in GeoPlan tool to locate conduit TF91299303.
- From the Results toolbar, click Graph.
- On the GeoPlan, select the conduit.
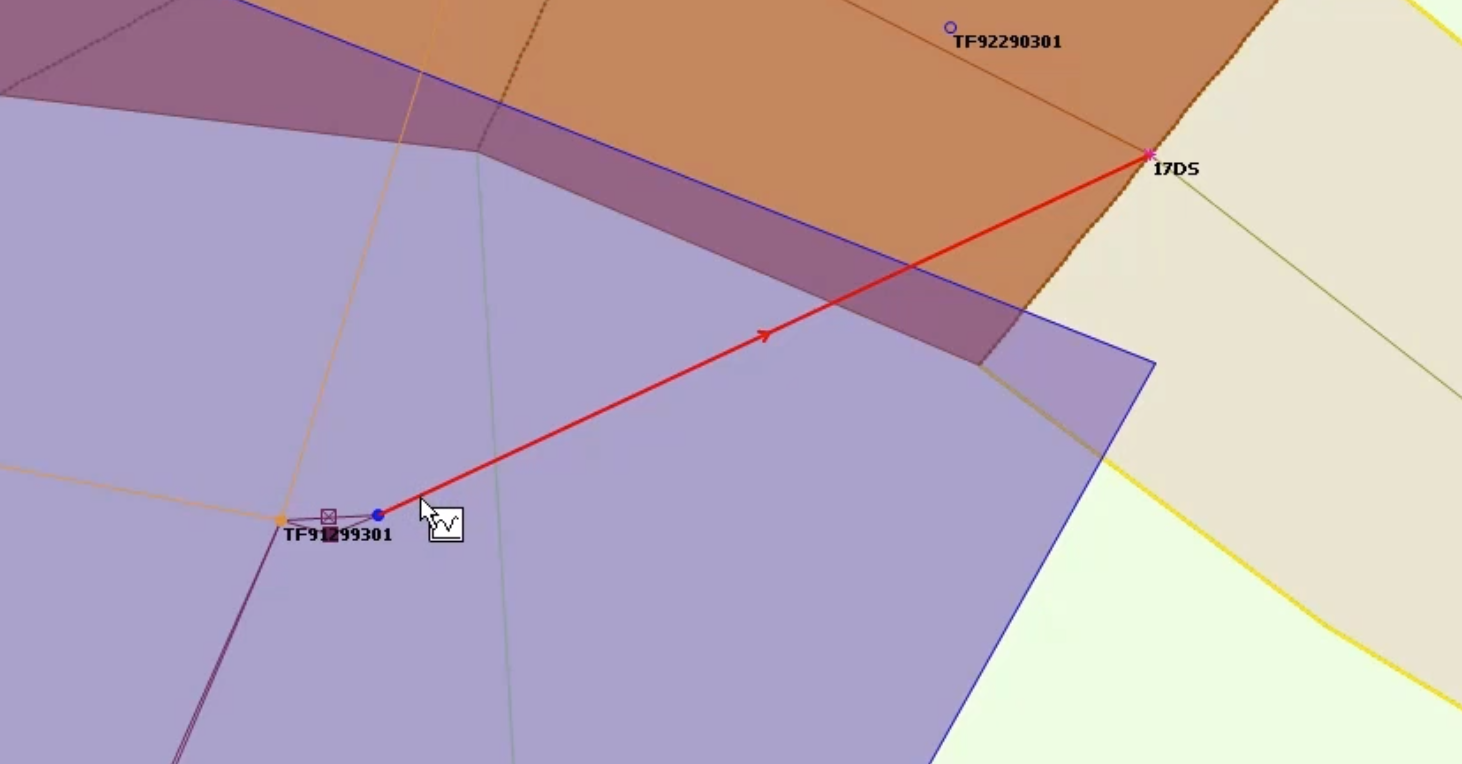
- In the Graph dialog box, select Flow.
- Click OK.
The graph shows that flow is coming up the pipe from the river and inundating the sewer network.
To investigate the simulation results using themes:
- From the Database, drag the 1D Results theme onto the simulation results.
- Use the Replay Control toolbar to replay the simulation, or show the maxima results to see the areas of flooding in the model.