Performing a water quality calibration
Set up, run, and review the results of a water quality (WQ) calibration to calibrate pipe wall coefficients for a pressure zone.
Tutorial resources
These downloadable resources will be used to complete this tutorial:
Step-by-step guide
Perform a water quality calibration using InfoWater Pro’s Water Quality (WQ) Calibrator to calibrate pipe wall coefficients for a pressure zone.
- Double-click the desired project .aprx file to open ArcGIS Pro.
- Click the InfoWater Pro tab to open the InfoWater Pro ribbon.
- In the Project panel, click Initialize.
Start by running a simulation for the current scenario:
- On the InfoWater Pro ribbon, Analysis panel, click Run to open the Run Manager.
- Click Run to run the simulation and create an output for the current scenario.
Next, run a chlorine water quality simulation for the current scenario.
- Still in the Run Manager, in the Simulation Options drop-down, select WQ_CL, Chlorine Analysis.
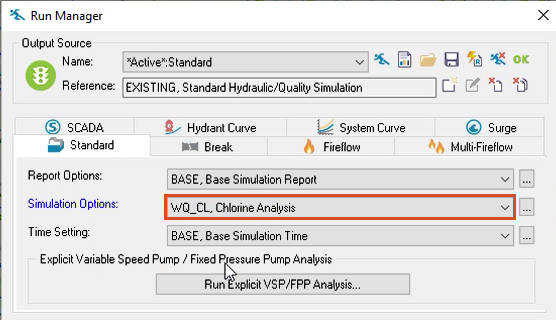
- In the Time Setting dropdown, make sure that BASE, Base Simulation Time is selected.
- Click Run to run the simulation and create an output for the Water Quality simulation.
- Close the Run Manager.
Now, open the WQ Calibrator:
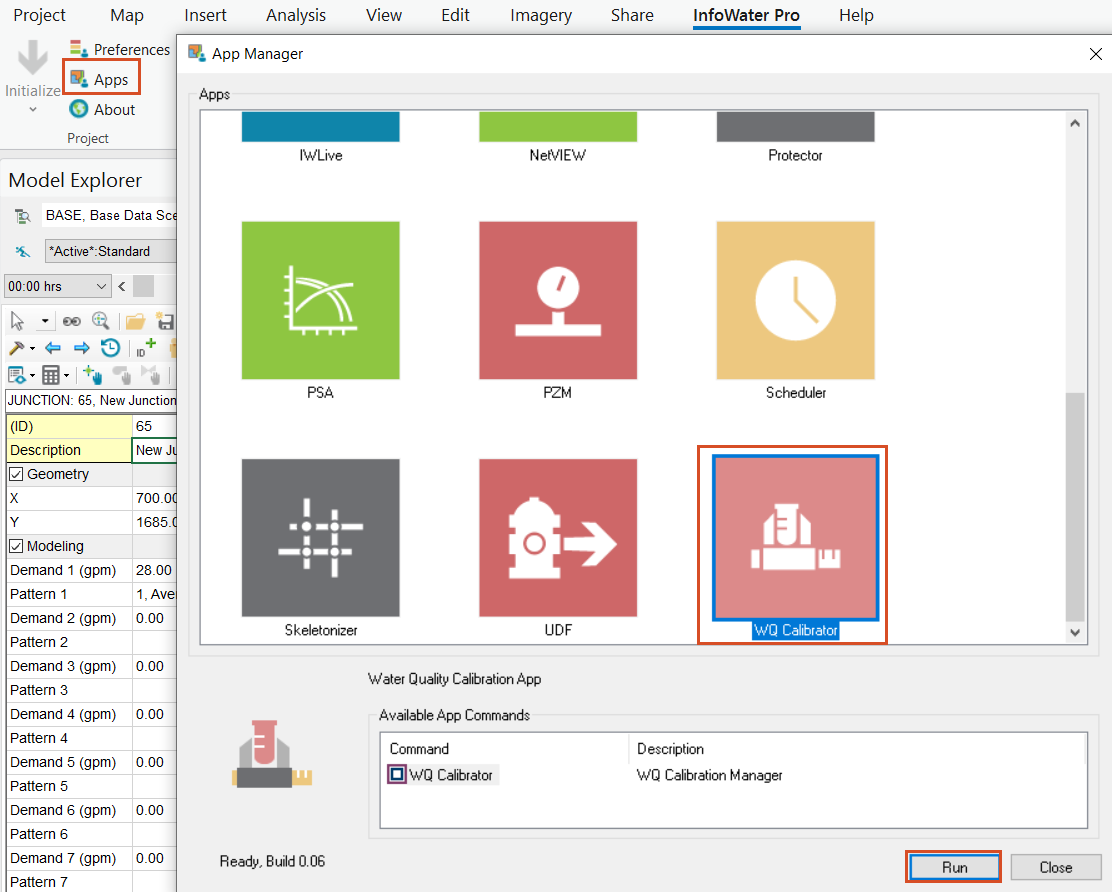
- On the InfoWater Pro ribbon, in the Project panel, click Apps.
- From the Apps Manager, select WQ Calibrator.
- Click Run to open the Water Quality Calibrator app.
To start setting up the calibration, in the Pipe Wall Coefficient Group tab, define the pipe groups to be used in the calibration analysis:
- In the Pipe Group Database Field drop-down, select PIPE_GROUP.
The PIPE_GROUP was already created and consists of four pipe groups of varying sizes in the model.
For each of the first 4 rows in the Pipe Group Database field, set the following values:
- Under Min, set the minimum wall coefficient roughness to 0.2.
- Under Max, set the maximum wall coefficient roughness to 2.
- Set Levels to 20.
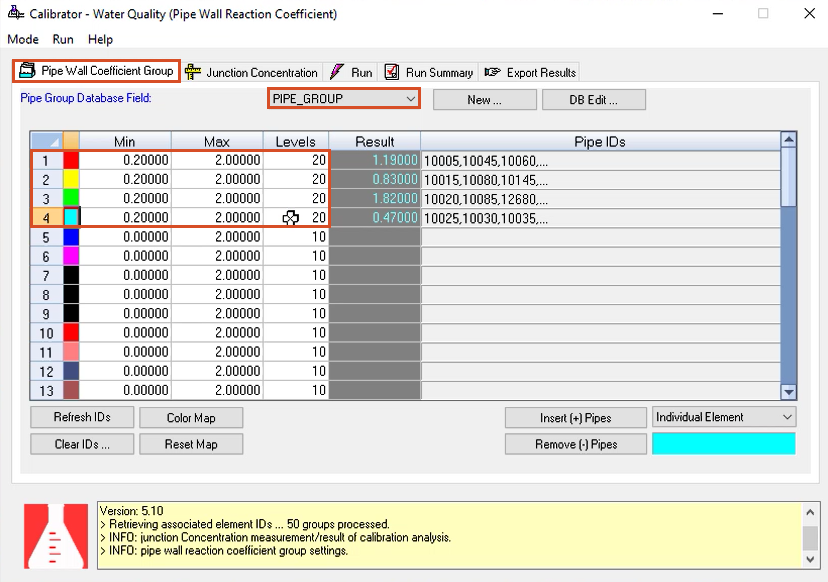
The increment for the calibration from Min to Max is determined by Levels (each increment = [Max-Min] divided by Levels).
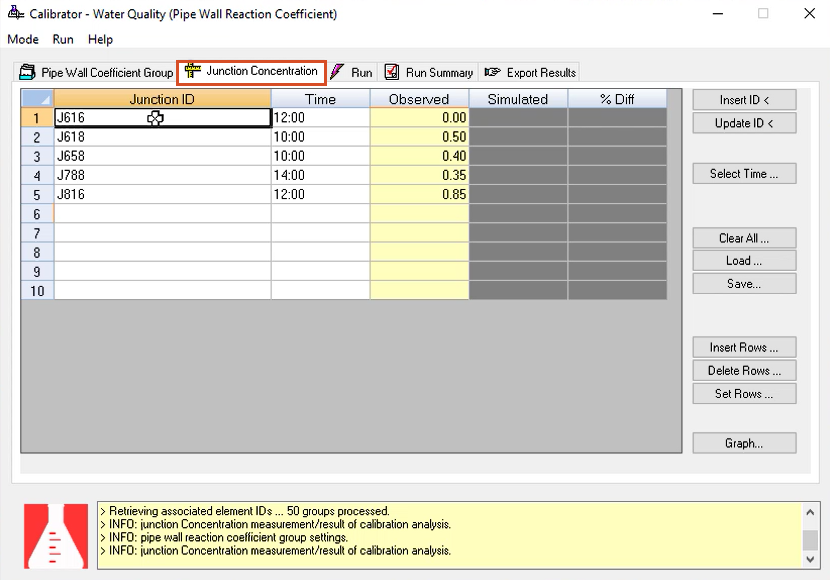
- Switch to the Junction Concentration tab.
In this tab, target field measurements are defined for selected junctions that are to be matched in the calibration analysis.
Add the following time and observed residual pressure for 5 junctions:
- In row 1, enter a Junction ID of J616, a Time of 12, and an Observed pressure value of 0.00.
- In row 2, enter: Junction ID J618, Time 10, and Observed 0.50.
- In row 3, enter: Junction ID J658, Time 10, and Observed 0.40.
- In row 4, enter: Junction ID J788, Time 14, and Observed 0.35.
- In row 5, enter: Junction ID J816, Time 12, and Observed 0.85.
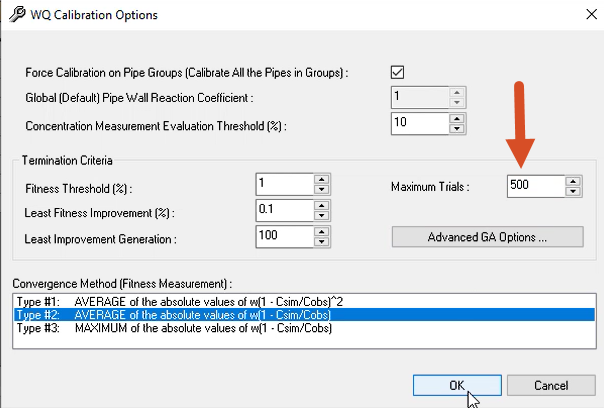
- From the Run menu, select Options.
- Under Termination Criteria, set the Maximum Trials to 500.
- Click OK.
Now, run the WQ calibration simulation and view the results:
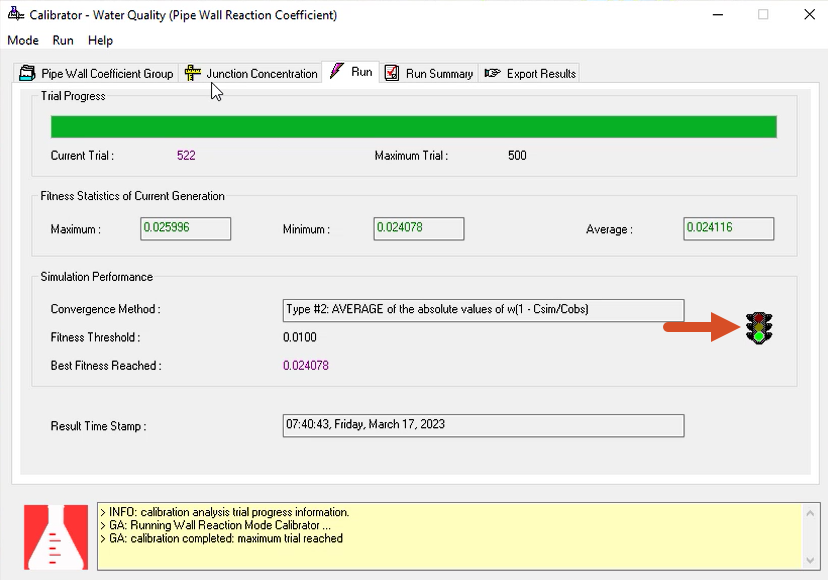
- From the Run menu, click Start to start the WQ calibration simulation process.
- On the Run tab, look for the green traffic light to indicate success.
- Once complete, review the results on the Pipe Wall Coefficient Group and Junction Concentration tabs, where data was entered for this example.
- On the Junction Concentration tab, click Graph to show the correlation between observed and simulated junction concentrations.
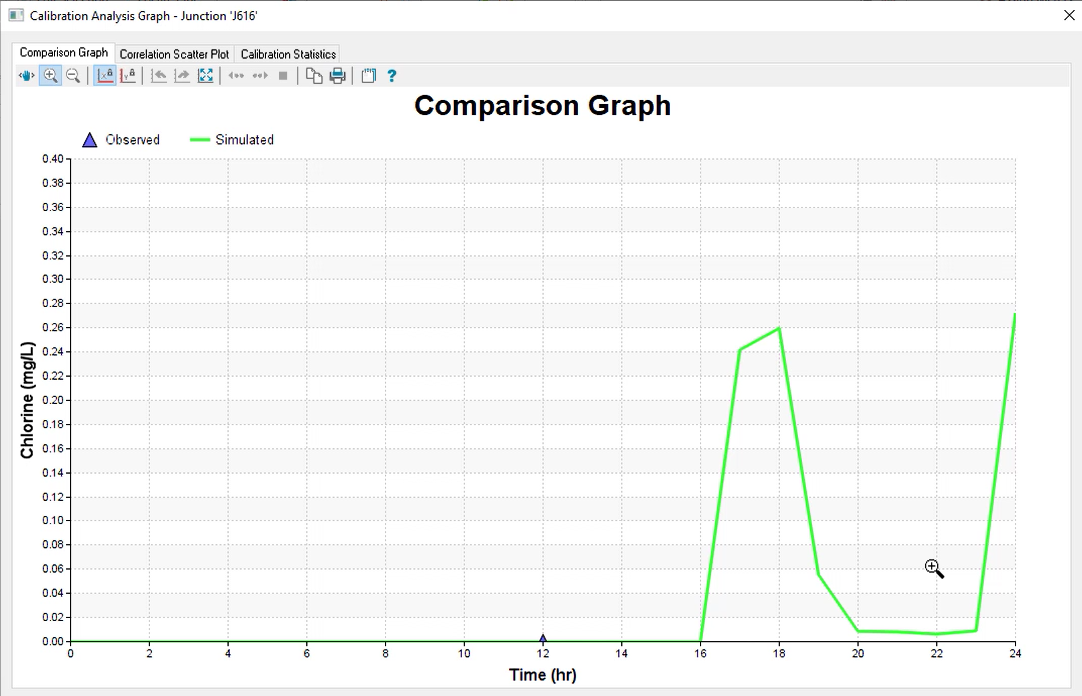
- Close the graph.
- Close the WQ Calibrator.
- Save the model.