Performing a Multi-Trace Analysis
Set up and run a multi-trace water quality analysis and view the results.
Tutorial resources
These downloadable resources will be used to complete this tutorial:
Performing a Multi-Trace Analysis
Step-by-step guide
A multi-trace analysis is a batch process that runs multiple and separate source trace analyses for each individual trace. Over time, it allows tracking of the percentage of water reaching any node in the network, with its origin at a particular set of nodes. The source nodes can be any node in the network, including tanks or reservoirs. Internally, the program treats the nodes as a constant source of a non-reacting constituent that enters the network with a concentration of 100.
- To open ArcGIS Pro, double-click the desired project .aprx file.
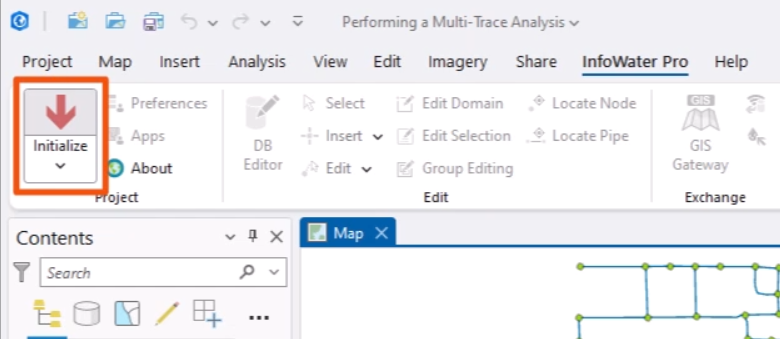
- Click the InfoWater Pro tab.
- On the InfoWater Pro ribbon, in the Project panel, click Initialize.
Start a multi-trace water quality analysis by setting up the simulation options.
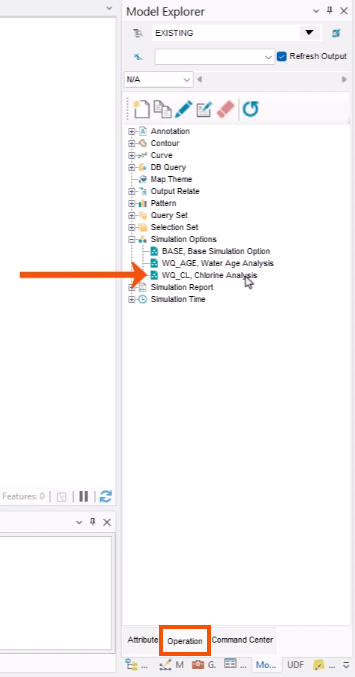
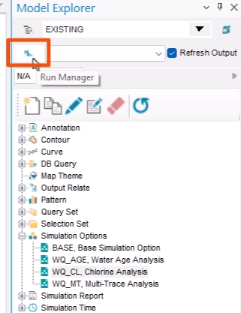
- In the Model Explorer, select the Operation tab.
- Expand the Simulation Options folder and double-click WQ_CL, Chlorine Analysis.
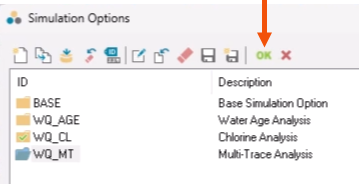
- In the Simulation Options dialog, click Clone.
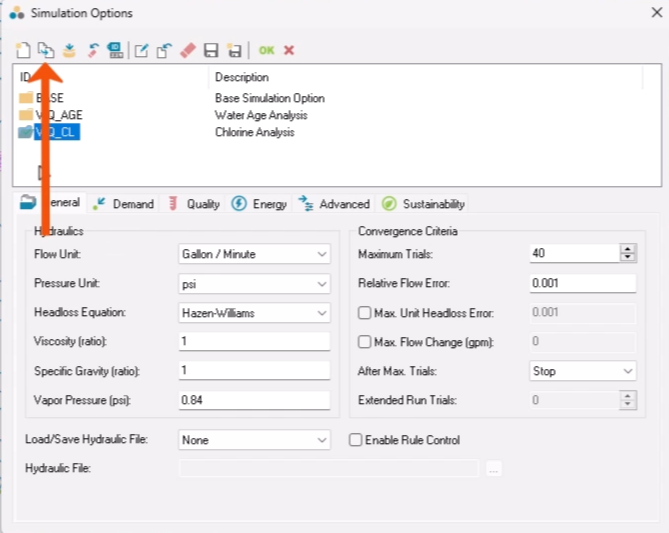
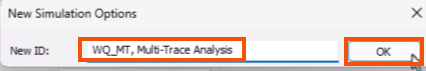
- In the New Simulation Options popup, enter a New ID, such as “WQ_MT, Multi-Trace Analysis”.
- Click OK.
- Back in the Simulation Options dialog, click the Quality tab.
- In the Type group, select Multi-Trace.
- Make sure the Trace Node field is blank and Multi-Trace is set to All Storage.
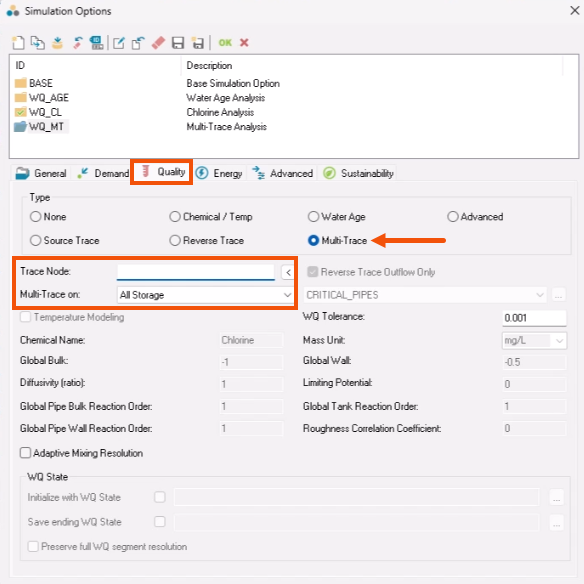
The All Storage option includes all tanks and reservoirs. When tanks are used as the source, all water leaving the tanks is attributed to the tank versus the source that provided it. Selecting All Reservoirs will result in an analysis that includes only true water sources.
- Click OK.
- Before running the multi-trace analysis, on the InfoWater Pro toolbar, in the View panel, click Reset Map Theme.
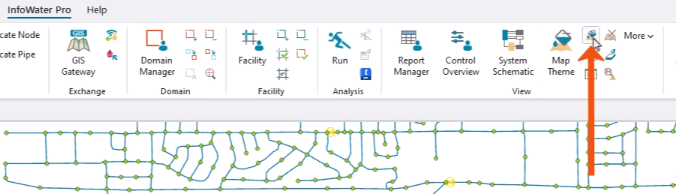
This step is necessary because multi-trace results are not viewed using the Map Theme tool.
Now, run the analysis.
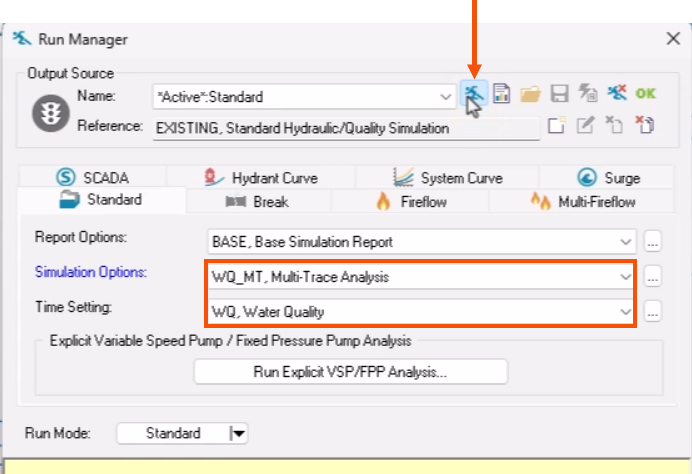
- In the Model Explorer, click Run.
- In the Run Manager, Standard tab, select the appropriate Simulation Options, such as WQ_MT, Multi-Trace Analysis.
- Select a Time Setting, such as WQ, Water Quality Analysis
- Click Run.
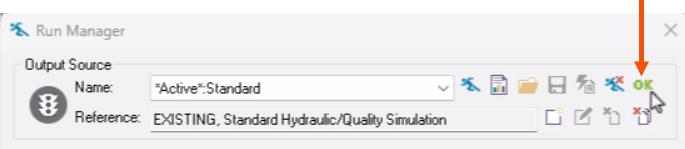
- When the simulation has completed successfully, click OK.
To view the results of the multi-trace analysis:
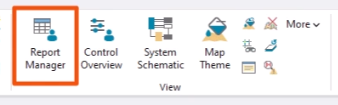
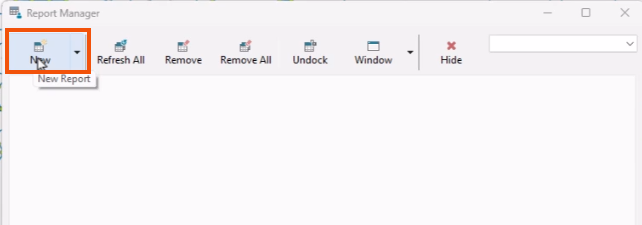
- In the View panel, click Report Manager.
- In the Report Manager dialog, click New.
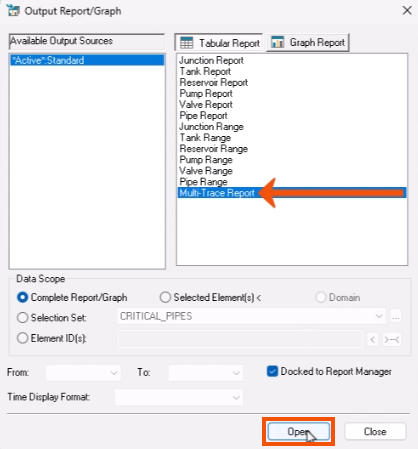
- In the Output/Report Graph dialog, in the Tabular Report list, select Multi-Trace Report.
- Click Open.
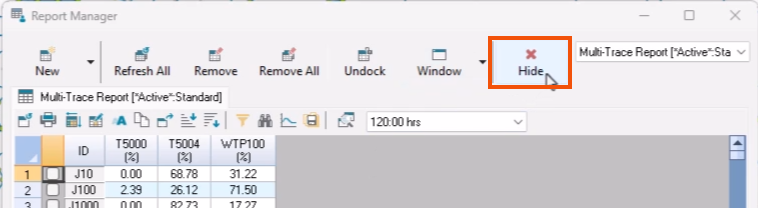
- In the Report Manager tabular report, change the output time to 120:00 hrs.
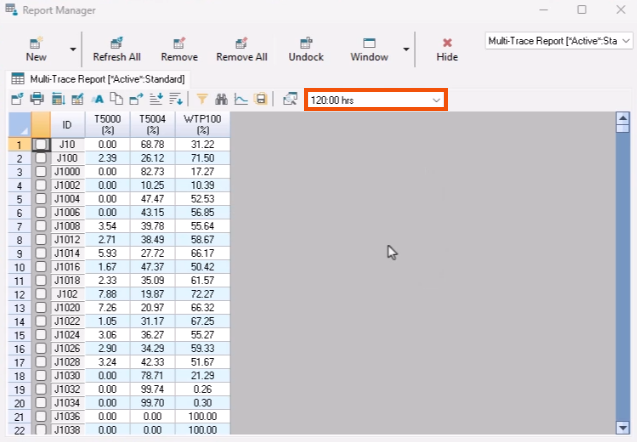
This report details the percentage of water that comes to each junction from each source at the specified time. Nodes adding up to more than 100% receive flow from a tank that is supplied by the reservoir.
The multi-trace function is a batch process that runs multiple and separate source trace analyses for each individual trace. It is not a simultaneous solution of multiple source traces; therefore, it is possible that the combined traces do not fully satisfy continuity, especially with tanks that experience both incoming and outgoing flows. Be aware that the total percentage of water combined from each source may not total 100%.
If more detail is required, use a trace analysis.
- After reviewing the table, Click Hide to close the Report Manager.