• 0
    • ASEAN (English)
    • Australia
    • België
    • Belgique
    • Brasil
    • Canada (English)
    • Canada (Français)
    • Česko
    • Danmark
    • Deutschland
    • España
    • Europe (English)
    • France
    • Hong Kong (English)
    • India (English)
    • Italia
    • Latinoamérica
    • Magyarország
    • México
    • Middle East (English)
    • Nederland
    • New Zealand
    • Norge
    • Österreich
    • Polska
    • Portugal
    • Singapore (English)
    • Suomi
    • Sverige
    • Schweiz
    • South Africa (English)
    • Suisse
    • Svizzera
    • Türkiye
    • United Kingdom
    • United States
    • 中国大陆地区
    • 台灣地區
    • 日本
    • 한국­
  • Architecture, Engineering
    & Construction
    architecture engineering and construction collection logo

    Integrated BIM tools, including Revit, AutoCAD, and Civil 3D

    Top products
    • AutoCAD
    • Revit
    • Civil 3D
    • AutoCAD LT
    • BIM Collaborate Pro
    Product Design
    & Manufacturing
    product design manufacturing collection logo

    Professional CAD/CAM tools built on Inventor and AutoCAD

    Top products
    • Inventor
    • AutoCAD
    • Fusion
    • Fusion extensions
    • Navisworks
    Media
    & Entertainment
    media and entertainment collection logo

    Entertainment content creation tools, including 3ds Max and Maya

    Top products
    • 3ds Max
    • Maya
    • Arnold
    • Flow Capture
    • Flow Production Tracking
    View all products
    Start a trial Download your software Download file viewers
    Discover
    • Industry solutions
    • Autodesk Industry Cloud
    • Educational access
    How to buy
    • Buying with Autodesk
    • Pay as you go with Flex
    • Special offers
    • Help with buying
    • Product support
    • System requirements
    • Installation
    • Account management support
    • Educational support
    • Partner Finder
    • Autodesk consulting
    • Contact support
    • Learning
    • Certification
    • Training
    • Autodesk University
    • Conferences and events
    • Success planning
    • Expert Coaching
    • Autodesk Community
    • Groups
    • Blogs
    • Developer Network
    • Autodesk Customer Value
  • Education

    Learning

    Home

    Catalog

    Certification

    Certification overview

    Architecture, Engineering & Construction

    Design & Manufacturing

    Media & Entertainment

    Support & Policies

    My dashboard

    Learning

    Home

    Catalog

    Certification

    My dashboard

    • Previous tutorial


    • Next tutorial

    • InfoWater Pro

    Creating an animated thematic map

    Color code various attribute values to view and animate simulation results in the map display.

    Type:

    Tutorial

    Length:

    10 min.


    Tutorial resources

    These downloadable resources will be used to complete this tutorial:

    iwtr2023M08U05_Creating-an-Animated-Thematic-Map.zip - (3 mb)

    Step-by-step:

    To help view extended period simulation results, you can create an animation of a color-coded map. For example, you can configure the map display options to create an animated map of pressure for junctions and velocity for the pipes in a network.

    1. Open the appropriate .aprx file in ArcGIS Pro.
    2. From the ribbon, InfoWater Pro tab, Project panel, click Initialize.
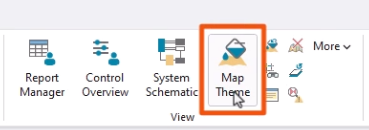
    3. On the ribbon, InfoWater Pro tab, View panel, click Map Display.
      The ribbon, InfoWater Pro tab, View panel, with Map Display being selected
    1. In the Map Display dialog box, set Element Type to Junction.
    2. Set Data Source to Active Output.
    3. Set Data Field to Pressure.
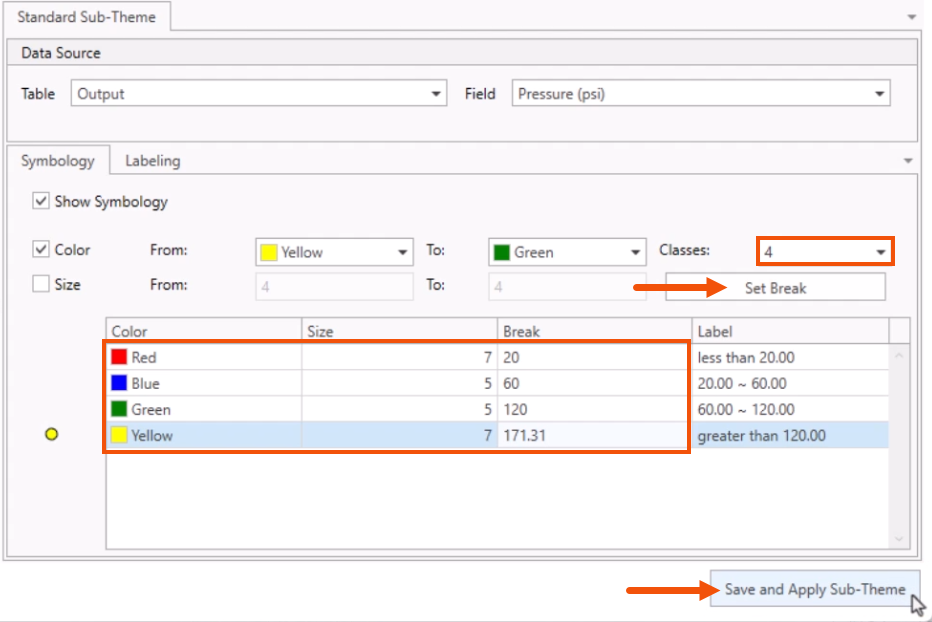
    4. Set Classes to 4.
    5. Select Set Breaks.
    6. In the table, set Row 1: Color Red, Size 7, Break 20.
    7. Set Row 2: Color Blue, Size 5, Break 60.
    8. Set Row 3: Color Green, Size 5, Break 120.
    9. Set Row 4: Color Yellow, Size 7, Break 171.31.
    10. Click Apply.
      The Map Display dialog box, with the Junction Classes settings configured
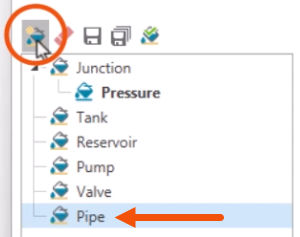
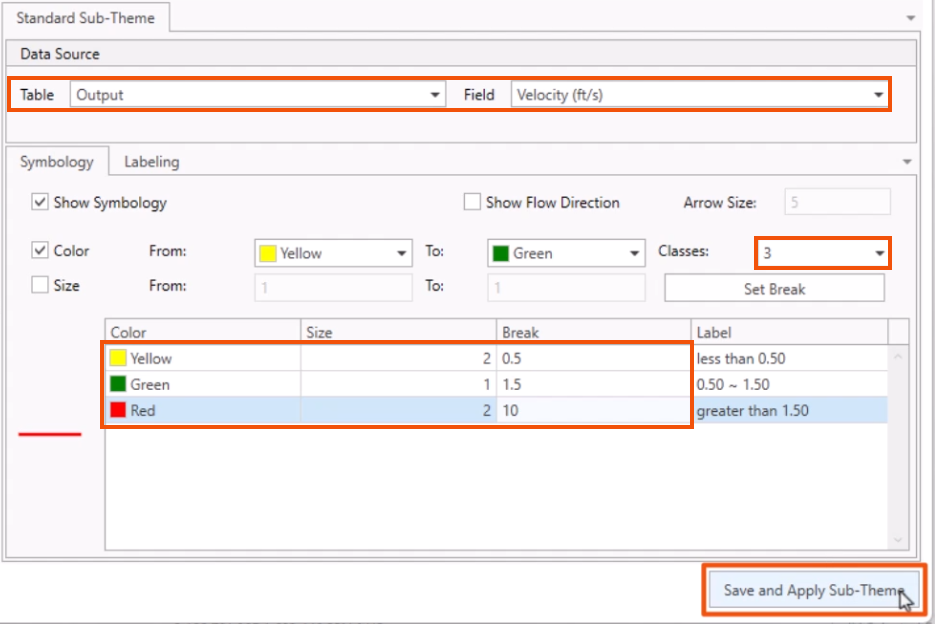
    1. Set Element Type to Pipe.
    2. Set Data Source to Active Output.
    3. Set Data Field to Velocity.
    4. Set Classes to 3.
    5. Select Set Breaks.
    6. In the table, set Row 1: Color Yellow, Size 2, Break 0.5.
    7. Set Row 2: Color Green, Size 1, Break 1.5.
    8. Set Row 3: Color Red, Size 2, Break 10.
    9. Click Apply.
      The Map Display dialog box, with the Pipe Classes settings configured
    1. Close the Map Display dialog box.
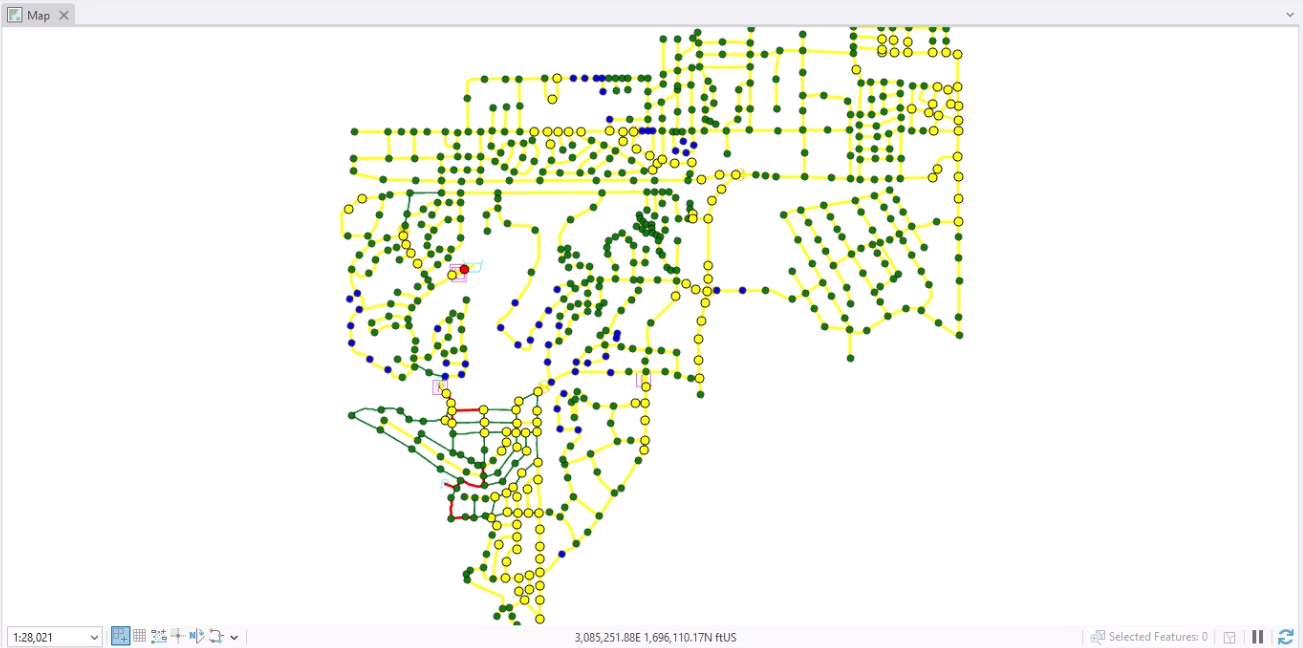
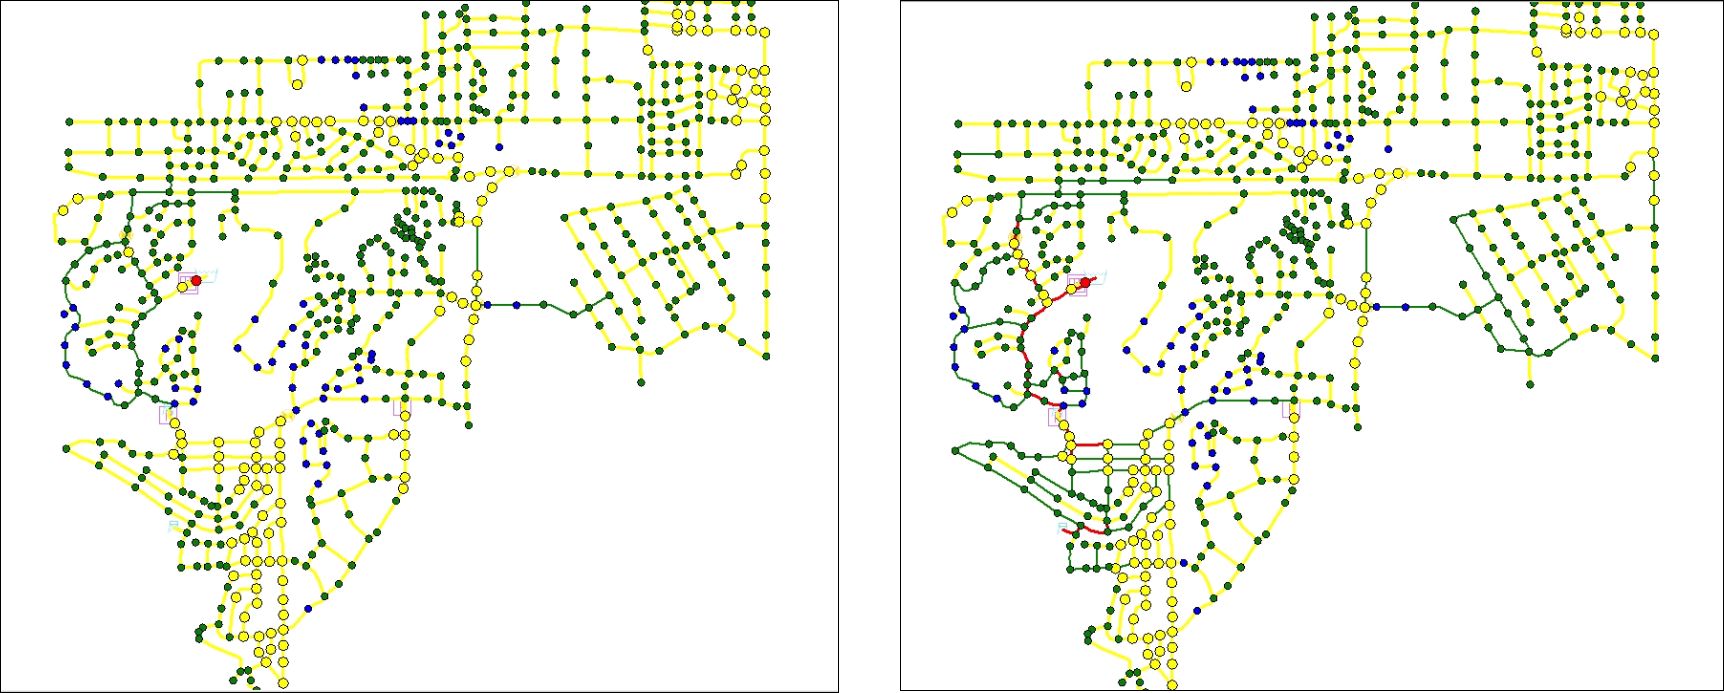
    2. In the model, view the pressure and velocity display you set.
      The Map view of the model, with the color-coded display for the junctions and pipes active
    1. In the Model Explorer, Attribute tab, slide the output timebar; in the map, the color-coding updates to reflect the current output value.
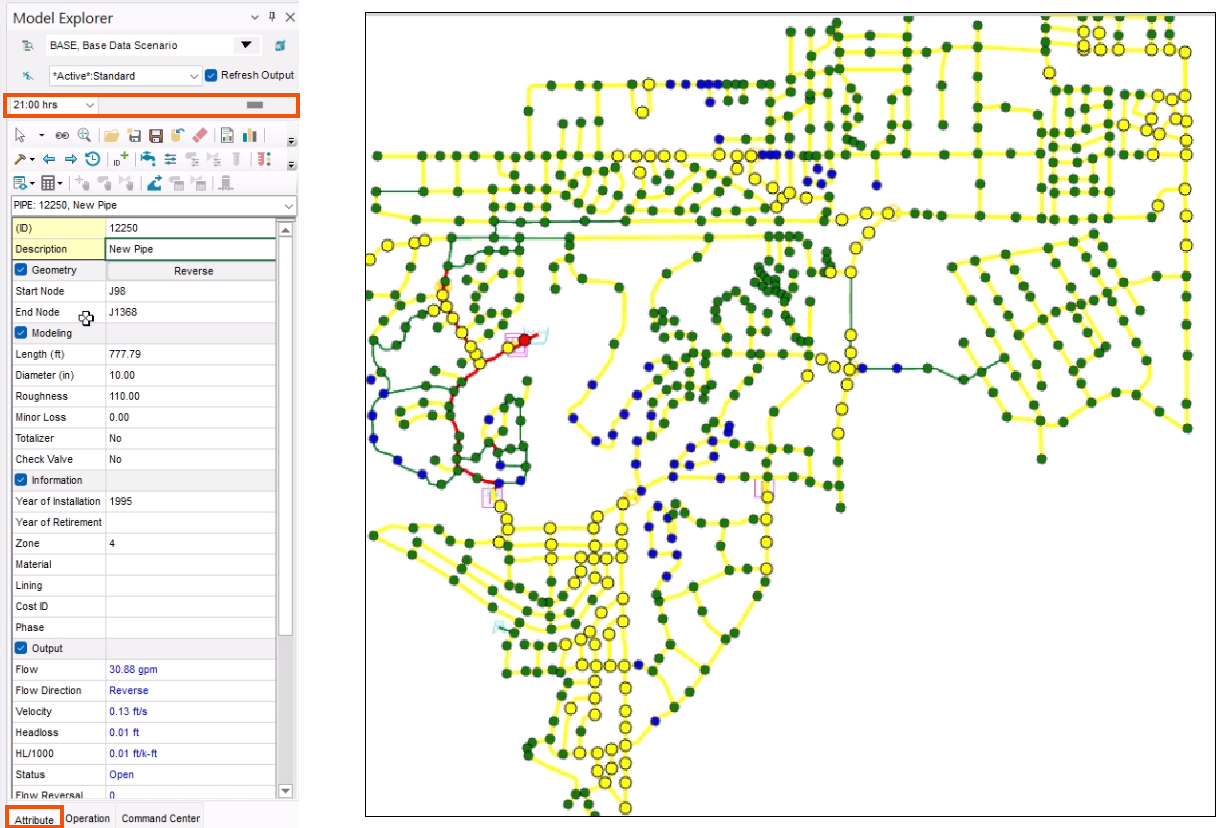
      The Map view and Model Explorer, with the output timebar slider called out and the map view showing the model at that point in time

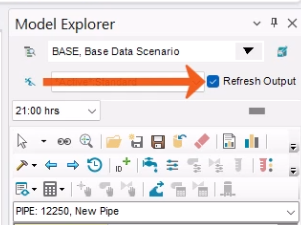
    Be aware that, in large models, dragging the timebar may cause the map to freeze as it loads in the new data corresponding to the timestep. You can disable Refresh Output to prevent this, but then you would need to re-enable it to update the map at your desired timestep.

    1. To set up an animation, set the timebar to 00:00hrs.
      Screenshot of the Model Explorer with the timebar dropdown called out
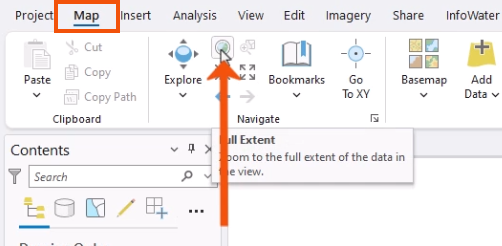
    1. On the ArcGIS Pro ribbon, Map tab, Navigate panel, click Full Extent.
      The Map ribbon, zoomed in on the Navigate panel, with Full Extent being selected
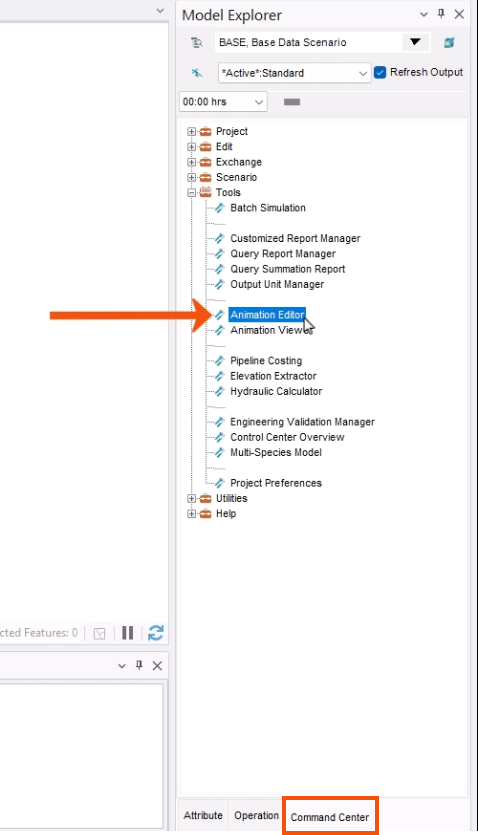
    1. In the Model Explorer, Command Center tab, expand Tool.
    2. Double-click Animation Editor.
      The Model Explorer, Command Center tab, with the Tools node expanded and Animation Editor called out as being selected
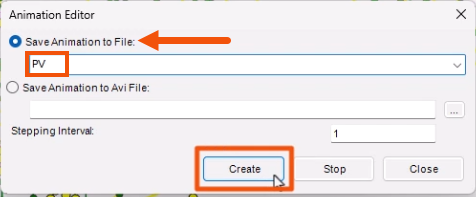
    1. In the Animation Editor dialog box, select Save Animation to File.
    2. Enter, “PV”, for Pressure Velocity.
    3. Click Create.
      The Animation Editor dialog box, with the new animation being named and saved

    A progress bar appears as a screenshot is taken of the thematic map at each output timestep. This takes a few minutes to complete.

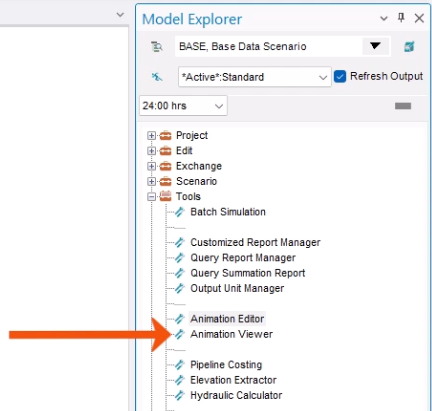
    1. In Model Explorer, under Tools, double-click Animation Viewer.

    In the Animation Viewer, click Delay Setting.

    The Animation Viewer, with the focus on the toolbar of play controls, where the Delay Setting icon is called out

    1. In the Display Delay dialog box, set Delay Time to 250 milliseconds.
    2. Click OK.
      The Display Delay dialog box, with the delay time being entered
    1. In the Animation Viewer, click Fast Forward.
    2. Watch the animation.
      A closeup of the Animation Viewer toolbar, with Fast Forward called out

    For optimal results, the viewer should be the same size and dimensions as the map area when the animation was created.

    Map Display provides a dynamic and powerful way of categorizing your project visually based on defined criteria. It can also be used for other data elements such as Pumps, Valves, Tanks, and Reservoirs.

    1. Close the Animation Viewer.
    2. To reset the Map Display controls back to the default, on the InfoWater Pro ribbon, View panel, click Reset Display.
      The InfoWater Pro ribbon, View panel, with Reset Display being selected and the Map view about to be set back to the default display
    Was this information helpful?

    Related learning

    Tutorial6 min.
    Verifying database queries via domains
    InfoWater Pro

    View
    Tutorial11 min.
    Understanding Demand Allocation
    InfoWater Pro

    View
    Tutorial8 min.
    Working with connectivity tools
    InfoWater Pro

    View
    Tutorial11 min.
    Understanding scenarios, datasets, and facilities
    InfoWater Pro

    View
    Tutorial5 min.
    Understanding InfoWater projects
    InfoWater Pro

    View
    Tutorial10 min.
    Using the Pressure Zone Manager
    InfoWater Pro

    View
    Tutorial8 min.
    Understanding GIS Exchange Clusters
    InfoWater Pro

    View
    Tutorial10 min.
    Understanding the ArcGIS-InfoWater relationship
    InfoWater Pro

    View
    Tutorial8 min.
    Using the query summation report
    InfoWater Pro

    View
    Tutorial8 min.
    Understanding Fireflow Analyses
    InfoWater Pro

    View

    Browse content with related tags

    • Industry:

      Water, Water owners and operators

    • Role:

      Civil engineer (Hydrology / hydraulics), Geographic information specialist

    Autodesk

    Company overview
    Careers
    Investor relations
    Autodesk Trust Center
    Newsroom
    Global Belonging at Autodesk
    LA28 Games

    Autodesk Foundation
    Sustainability
    Contact us
    Students and educators
    Affiliate program
    Autodesk Research
    Design & Make with Autodesk

    How to buy

    View all products
    Buying with Autodesk
    Renewal options
    Find a partner
    Sales and refunds
    Choose your subscription plan
    Pay as you go with Flex

    Support

    Manage your account
    Download and install software
    Autodesk Product Status
    Autodesk Community
    Education support
    Contact support

    Privacy | Do not sell or share my personal information | Cookie preferences | Report noncompliance | Terms of use | Legal | © 2025 Autodesk Inc. All rights reserved

    Sign in for the best experience

    Save your progress

    Get access to courses

    Receive personalized recommendations