Viewing simulation results with graphing tools
Use various graphing tools to view and analyze your simulation results.
Tutorial resources
These downloadable resources will be used to complete this tutorial:
Step-by-step guide
When working with simulation results, the graphing tools in InfoWorks ICM offer various ways to view and analyze results. Graphs are also useful to present data to colleagues, clients, and other stakeholders.
In this exercise, use various graphing tools to view and analyze simulation results.
To begin, copy the data out of the transportable database .icmt file for this tutorial.
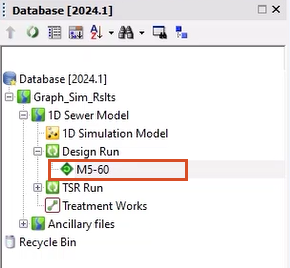
- Double-click the Design Run simulation to open it in the GeoPlan.
Start by graphing a single node in the simulation results.
- Click the Find in GeoPlan tool.
- Perform a Quick Find for node TF91296202.
- Click the Graph Pick tool.
![]()
- On the GeoPlan, pick the selected node.
- If a Multiple Selection popup appears, choose the first node, and then click OK.
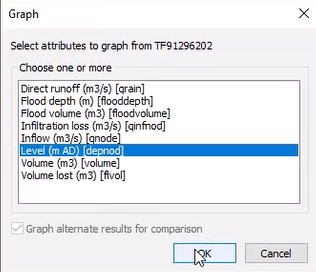
- In the Graph dialog box, for this example, select Level.
- Click OK.
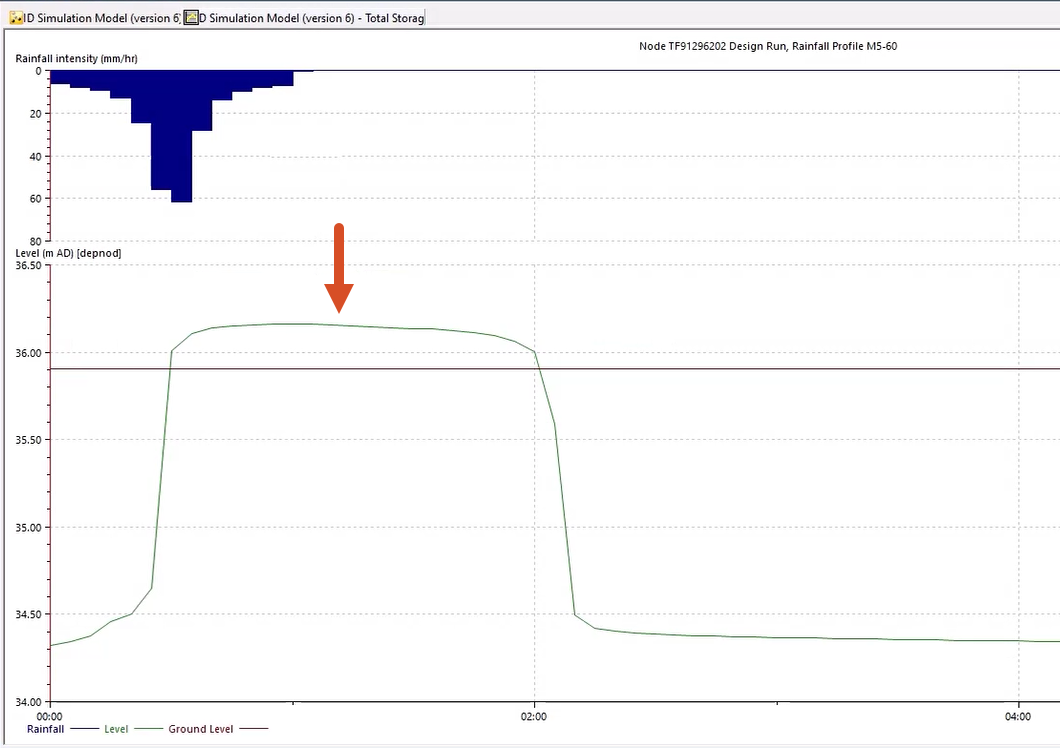
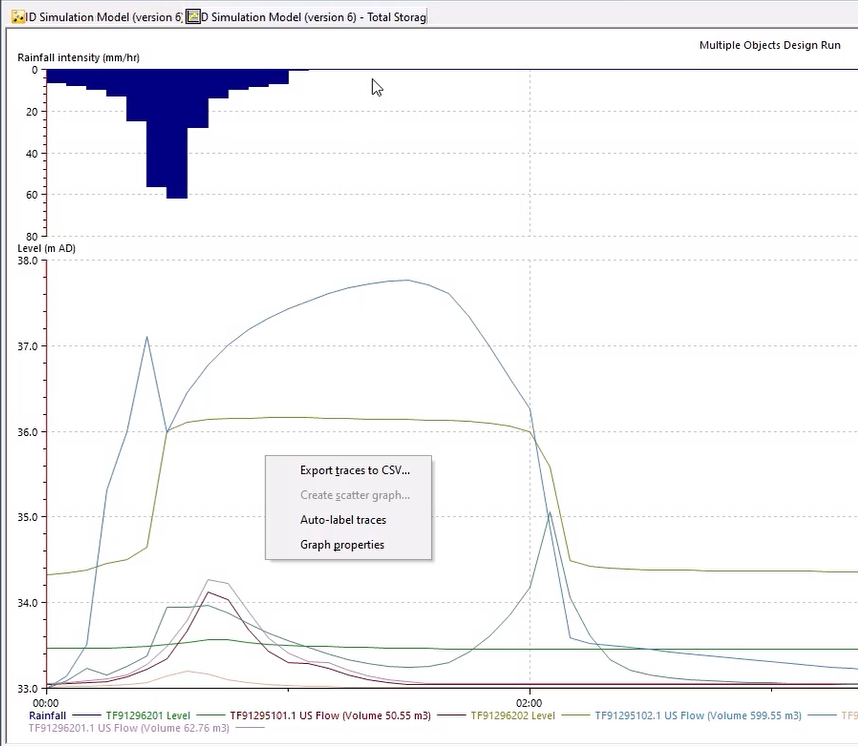
The graph appears, displaying level properties of the node throughout the replay results. Notice the Ground Level line. Anything above this line indicates flooding.
- Close the graph.
- In the Selection toolbar, click Clear selection to clear any active selections in the model.
To graph several objects at once:
- In the model, select multiple elements.
- In the Results toolbar, click Graph selected objects.
Select what to view in the results graph:
- In the Graph Selection dialog box, for this example, in the Left section, select Nodes.
- In the Attribute list, select Level.
- In the Right section, select Links.
- Under Attribute, select Flow.
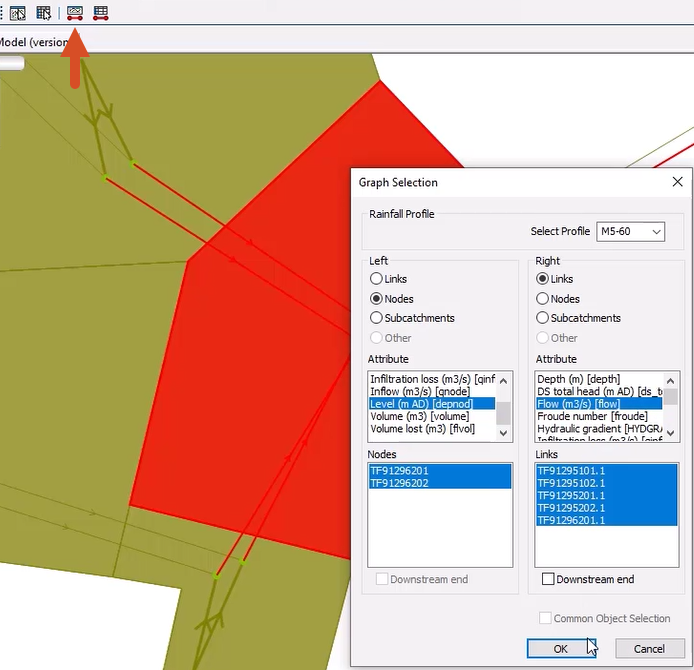
- Click OK to graph this multi-selection.
- Right-click the graph to see additional options, such as export to csv.
- Close the graph.
- Click Clear selection.
A graph report is a more advanced form of graphing and allows for comparing results, either from multiple locations or from multiple simulations.
To create a graph report:
- Click the Find in GeoPlan tool.
- Perform a Quick Find for link TF92292302.1.
- In the More GeoPlan Tools toolbar, click the Trace and select links upstream tool.
- On the GeoPlan, click the selected link.
- From the Results menu, select Graph Reports > Location Report.
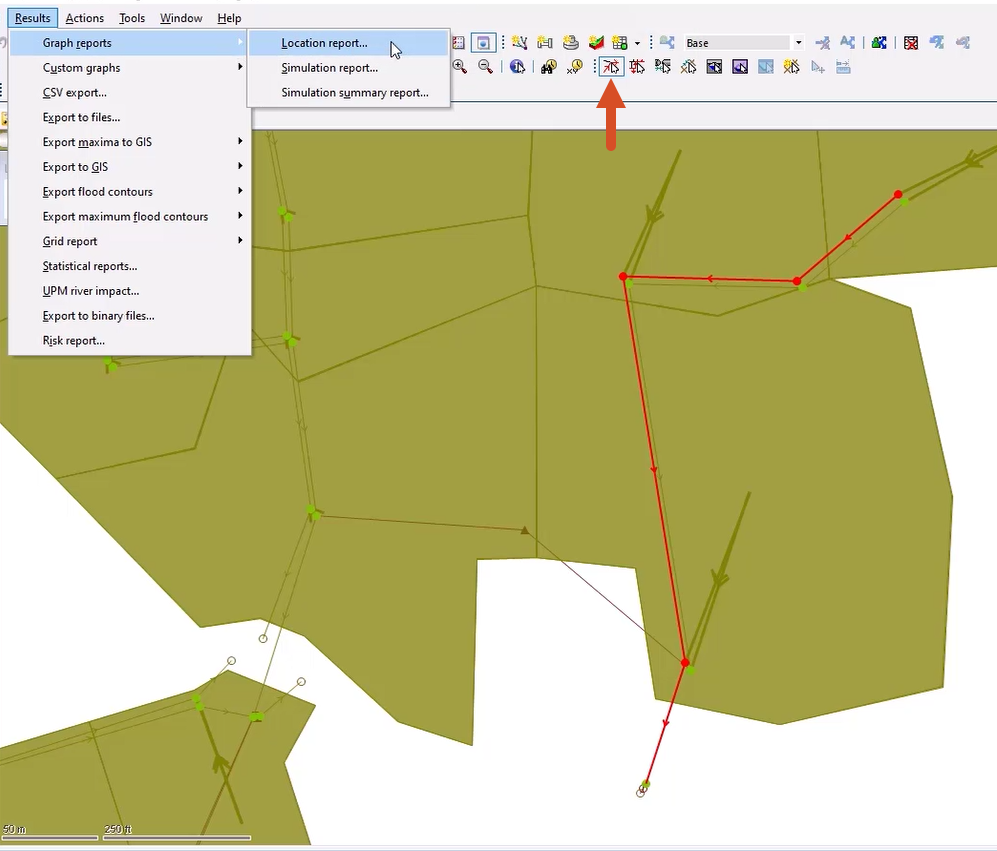
A Locations popup appears, displaying the selected simulation and selection list.
- These locations can be changed, but for this example, click Produce Graphs.
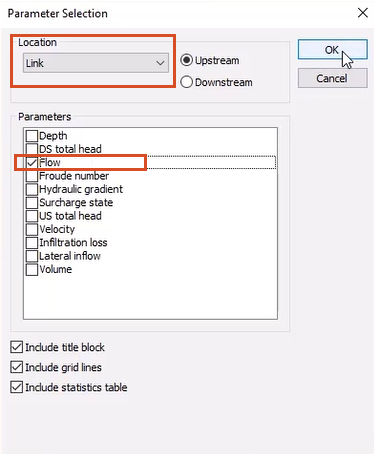
- In the Parameter Selection dialog box, under Location, select Link.
- In the Parameters section, select Flow.
- Click OK.
- Close the Locations popup.
- In the graph, compare the flow in the links to determine where a large portion of the flow is coming into the network.
- Zoom into the graph.
- Adjust the graph axes by double-clicking one of them to open the Graph Properties dialog box.
To adjust the color and style of the lines:
- Select the Traces tab.
- Under Title, select a line.
- In the Trace Style dialog box, adjust the settings, such as Symbol Color.
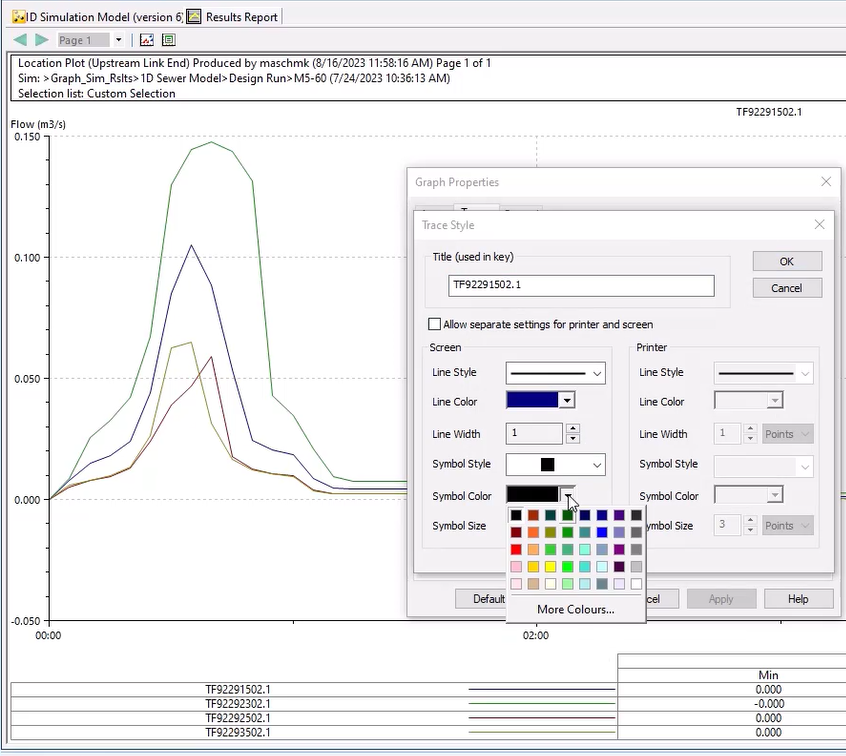
- Click OK.
- After changing a few properties of the graph, click OK.
- Close the graph.
- Click Clear selection.
It is also possible to create more flexible custom graphs and then save them to the model group for future use.
- Click the Find in GeoPlan tool and perform a Quick Find for the tank Storm_Tank1.
- With the Select tool enabled, press CTRL and select the link directly downstream from the tank, in the direction of Storm_Tank1.2.
With these selections active, create a selection list:
- Right-click the model group and select New InfoWorks > Selection list.
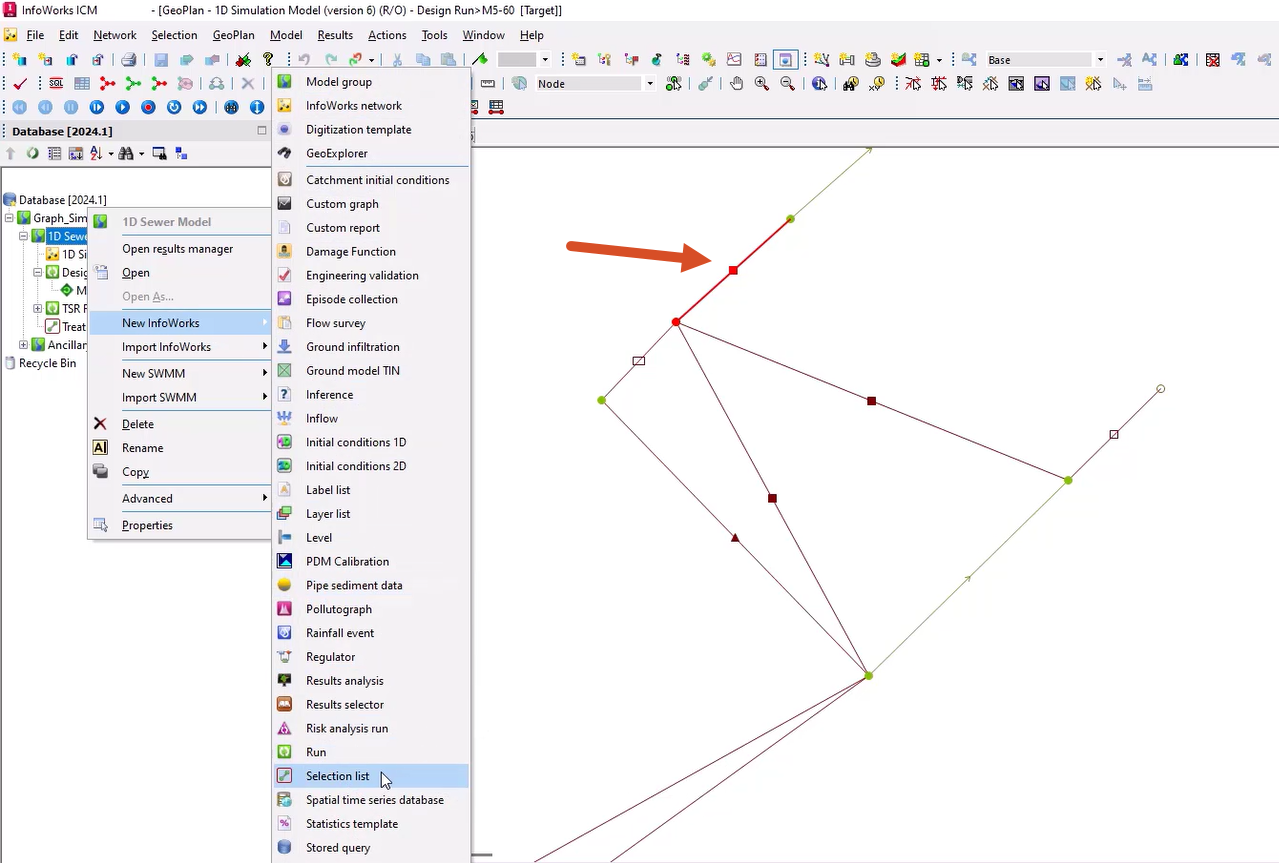
- Name the selection "Storm Tank Spill".
- Click OK.
Note: This is a static selection set and does not change based on the timestep.
Now create a custom graph report for this selection:
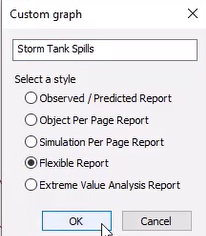
- Right-click the model group and select New InfoWorks > Custom graph.
- In the Custom Graph window, enter the name "Storm Tank Spills".
- Select Flexible Report as the style of graph.
- Click OK.
- From the Model Group, double-click Storm Tank Spills to open the graph setup tool.
- Drag the previously completed TSR Run into the Layout tab, Data section, and drop it into the Sim box.
- Drag Storm Tank Spill into the Selection list box.
- In the Trace properties section, in the first row, expand the Page drop-down and select 1.
- Under Graph , select 1.
- Set the Y-Axis to Left.
- Set the Data Source to TSR Run.
- Set the Location to Storm_Tank1 (Node).
- Set the Attribute to Level.
- Under Style, click More (…) to set the line color to Blue.
In the second row:
- Set the Page to 1.
- Set the Graph to 2.
- Set the Y-Axis to Right.
- Set the Data Source to TSR Run.
- Set the Location to Storm_Tank1.2 (Link).
- Set the Attribute to DS Flow.
- Under Style, click More (…) to set the line color to Red.
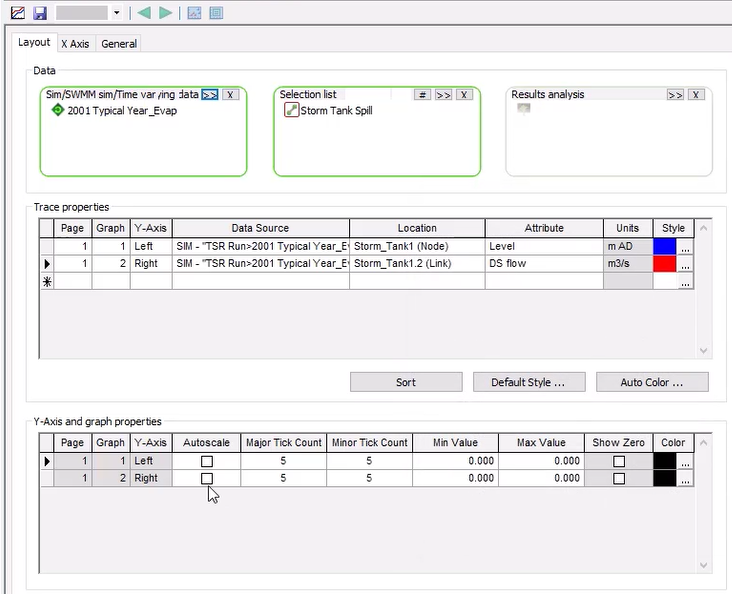
- In the Y-Axis and graph properties section, select Autoscale for each graph.
- Click Save.
- Click the Graph View tool to view the flexible graph report.
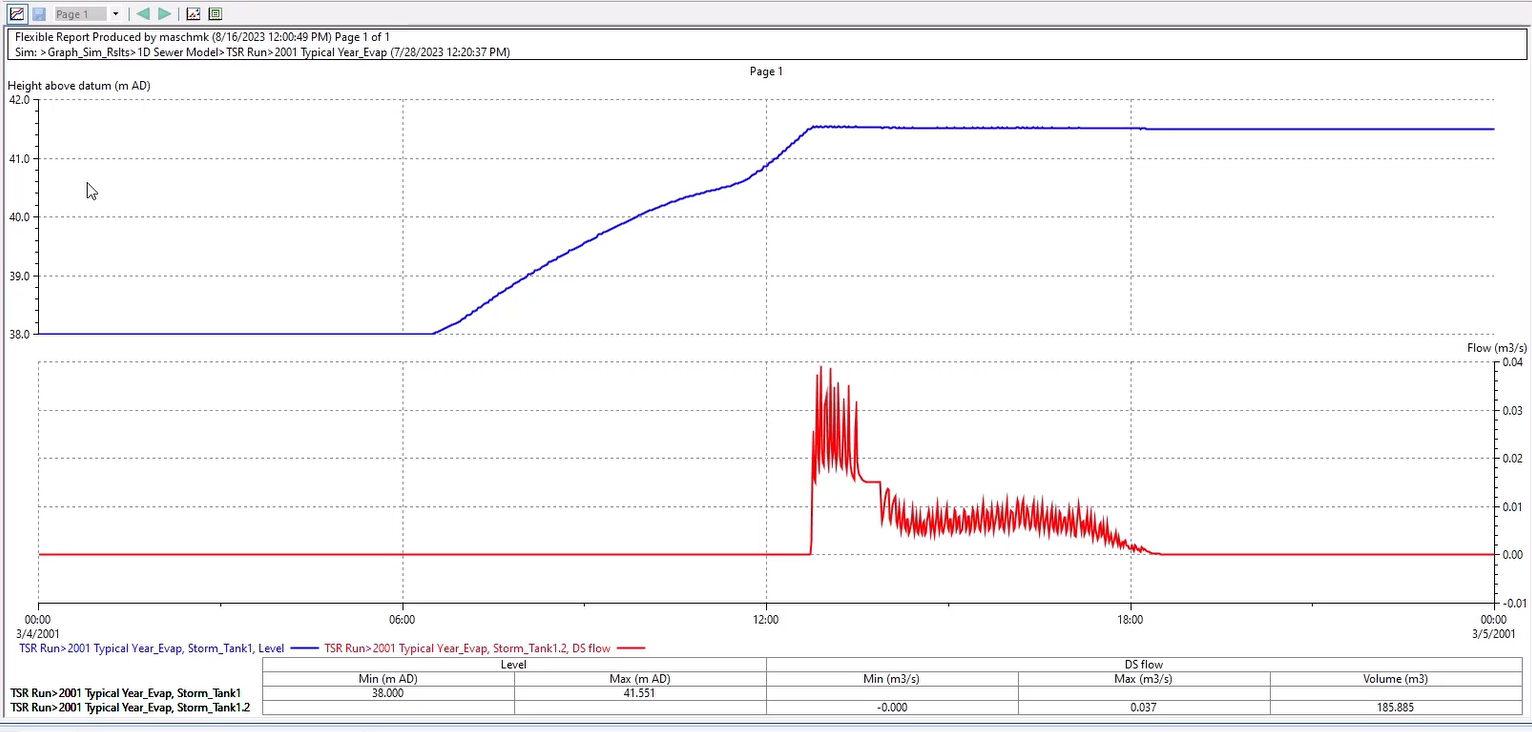
- To change any of the custom graph parameters, click the Graph View tool again to return to the graph setup page.
- For example, to set it up as two graphs on one page, change the value in the second row of the Graph column to 1.
- When done making changes, Close the graph.