Create flush zones for a UDF model
Any referenced datasets can be downloaded from "Module downloads" in the module overview.
Step-by-step guide
With InfoWater Pro UDF, the Flush Zone Manager can be used to create and manage parameters and characteristics for specific flush zones within a distribution system. This example imports flush zone GIS data, and then uses the Flush Zone Manager to create flush zones for the hydraulic model.
- Open a hydraulic model in InfoWater Pro.
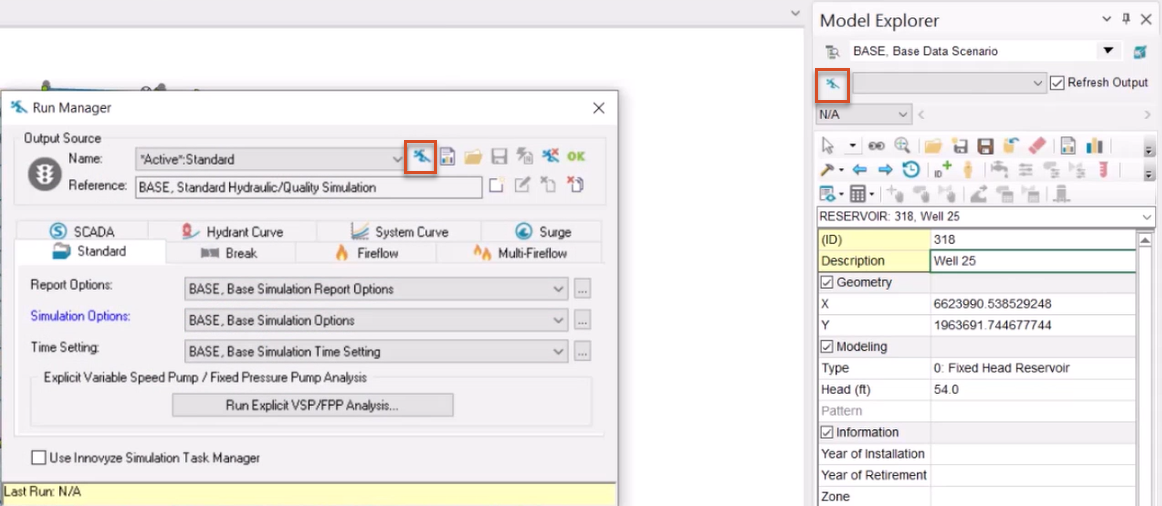
- From the Model Explorer, click Run to open the Run Manager.
- Click Run to run a simulation and check that the model is hydraulically sound.
- Click OK.
To add flush zone GIS data to the model:
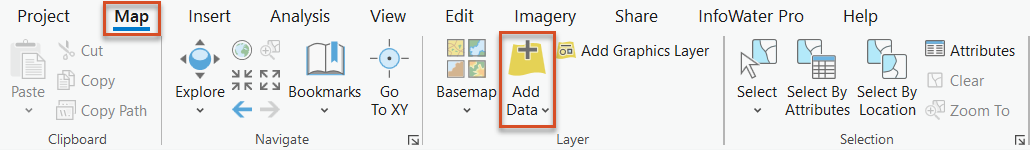
- From the Map ribbon, Layer panel, click Add Data.
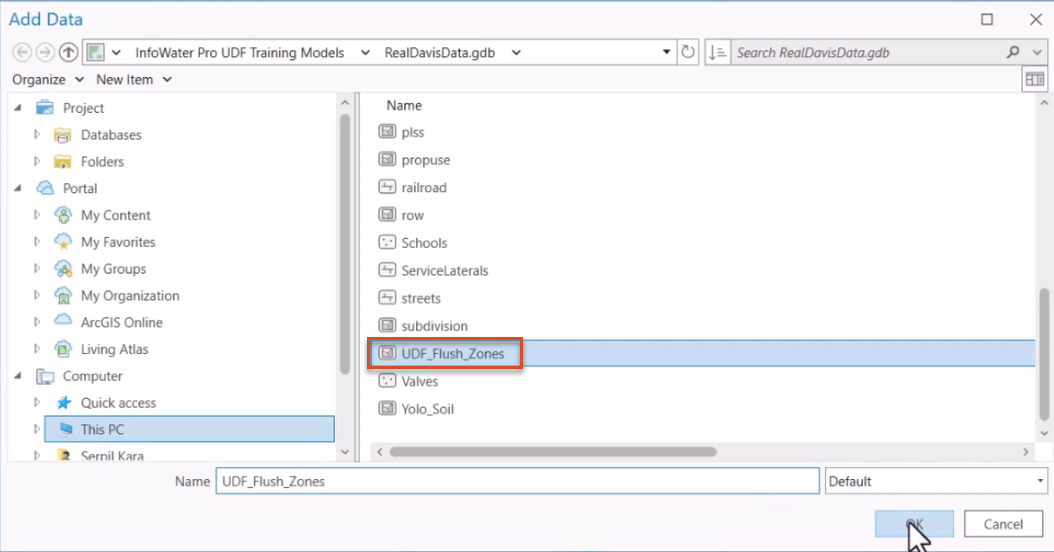
- Navigate to and select the GIS data to import. In this example, the shapefile UDF_Flush_Zones is selected.
- Click OK.
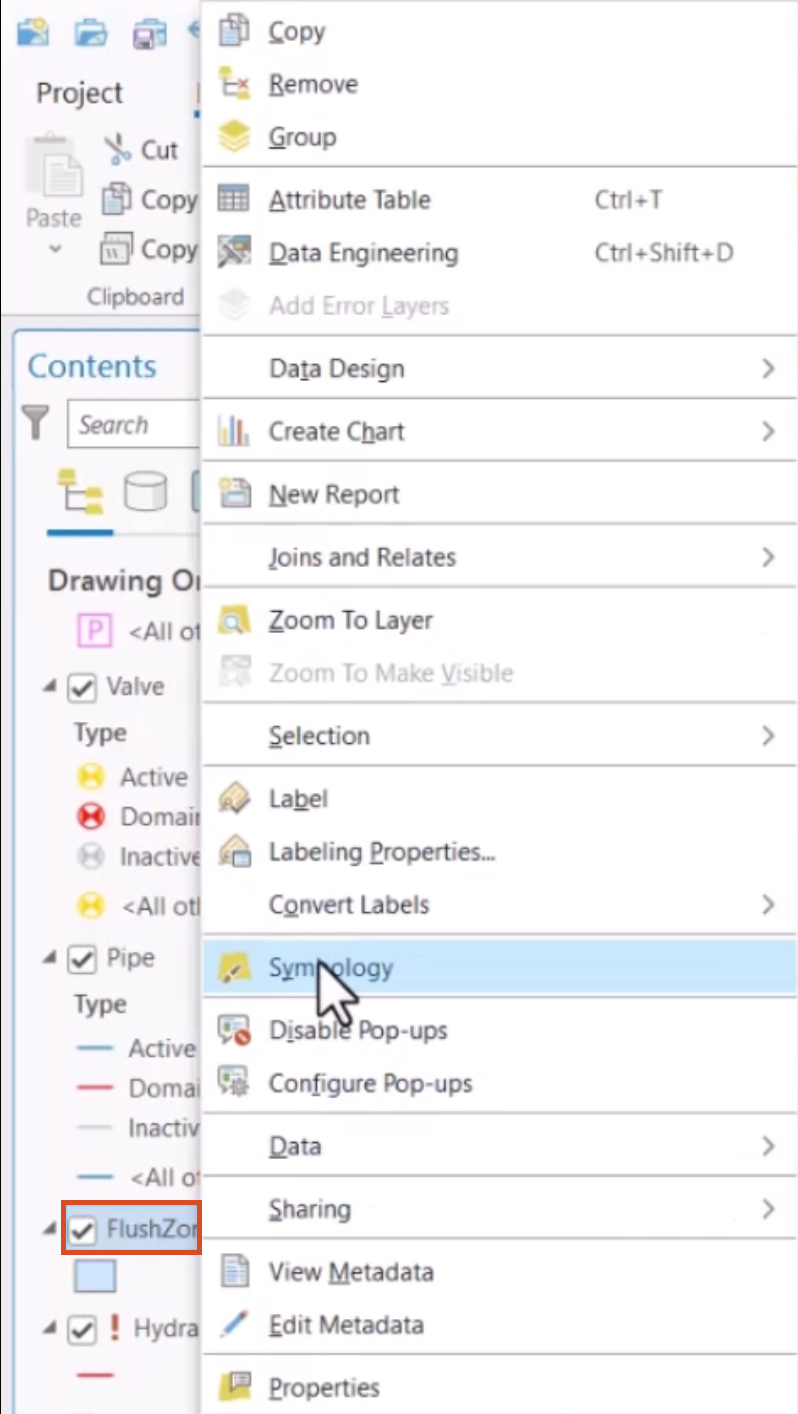
- In the Contents pane, right-click the new layer and select Symbology.
- In the Symbology pane, with the Primary symbology tab active, expand the drop-down and click Unique Values.
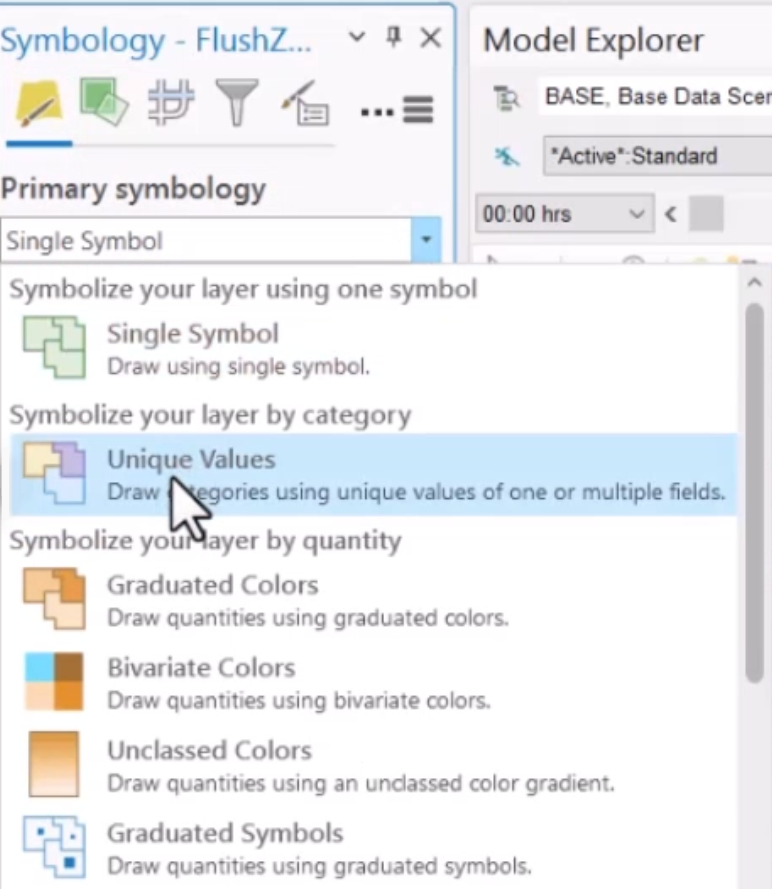
- Expand the Field 1 drop-down, and select ZONE.
The map updates by color-coding each flush zone. In this example, Zone 01 is assigned a pink color and Zone 02 is a green color.
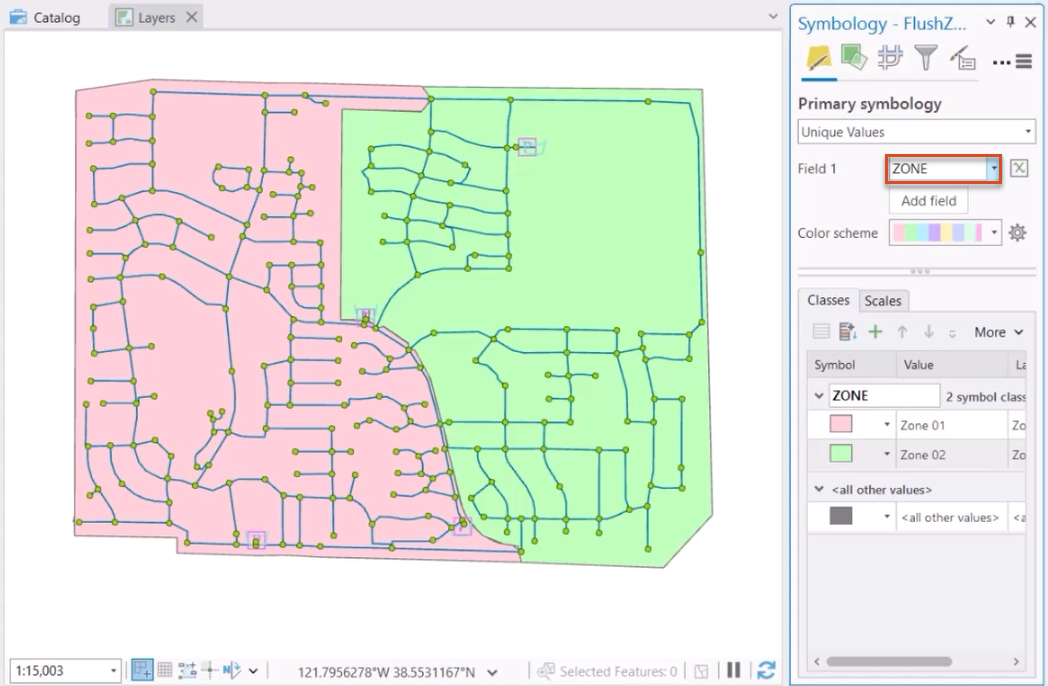
- Right-click <all other values> and select Remove.
- Close the Symbology pane.
To open the Flush Zone Manager:
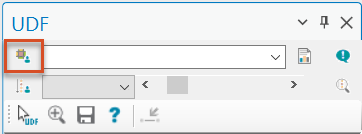
- From the Model Explorer window, switch to the UDF tab.
- Select Flush Zone Manager.
There are currently no flush zones listed in the Flush Zones group box.
To create a zone:
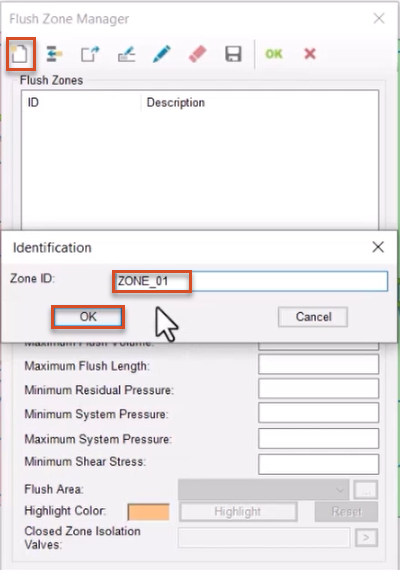
- Click New Flush Zone to open the Identification dialog box.
- In the Zone ID field, enter a name for the new zone, such as “ZONE_01”.
- Click OK.
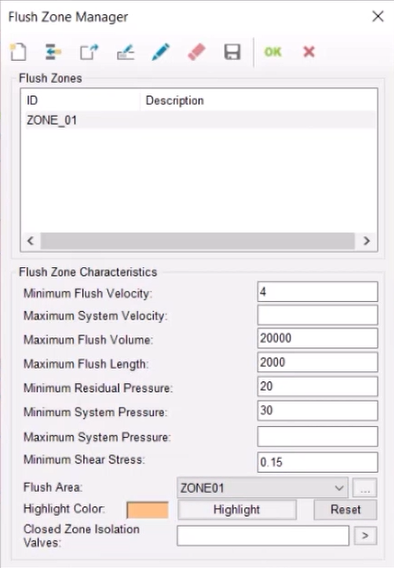
In the Flush Zone Characteristics group box, enter the following:
- Set the Minimum Flush Velocity to 4.
- Set the Maximum Flush Volume to 20,000.
- Set the Maximum Flush Length to 2,000.
- Set the Minimum Residual Pressure to 20.
- Set the Minimum System Pressure to 30.
- Set the Minimum Shear Stress to 0.15.
- Expand the Flush Area drop-down and pick ZONE01.
When flush sequences run, UDF compares each of these values against the actual calculated value during a simulation. If the model does not exceed the entered value, a warning will be generated.
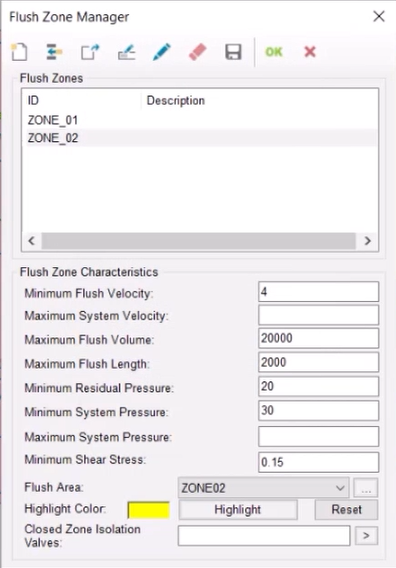
Now, create another flush zone:
- Click New.
- Enter a name, such as “ZONE_02”.
- With the new zone selected in the Flush Zones group box, assign the same values to the fields edited for the first zone.
- In the Flush Area drop-down, select ZONE02.
To change the zone color:
- Click the Highlight Color box.
- Pick a color from the palette. In this example, yellow is chosen.
- Click OK to close the Color dialog box.
- Click OK to close the Flush Zone Manager.