Review flush zone statistics and notify affected customers
Any referenced datasets can be downloaded from "Module downloads" in the module overview.
Step-by-step guide
After simulating a flushing sequence within a flush zone in InfoWater Pro UDF, flush zone statistics can be viewed, including the number of sequences in the zone, the total length of pipe flushed, flush volume, and other results data. Additionally, the Notify Affected Customers tool can identify which properties are in or near a flush zone, so that they can be informed about the potential impacts of a flushing operation.
To view flush zone statistics:
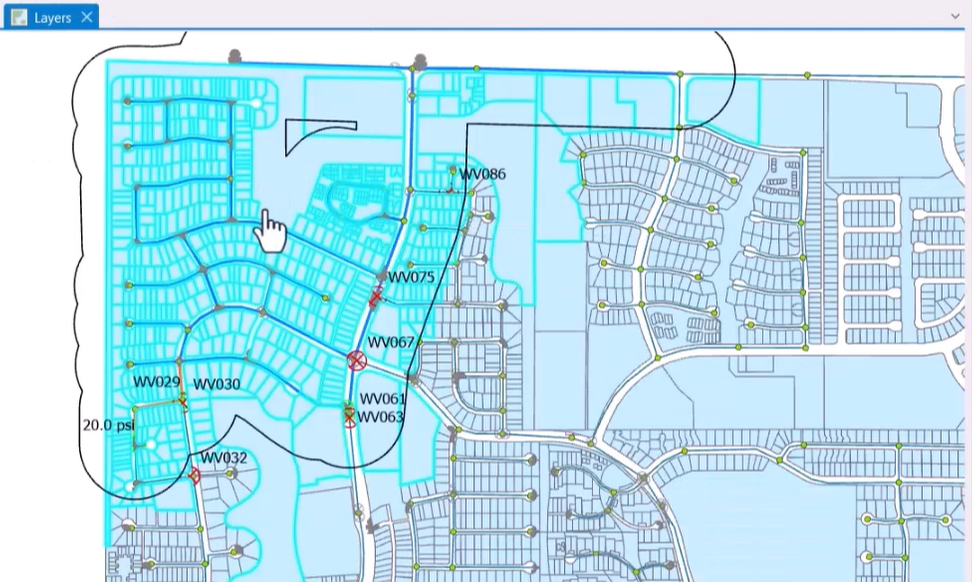
- Begin with a UDF model containing at least one flush zone and at least one successfully run flushing sequence within it.
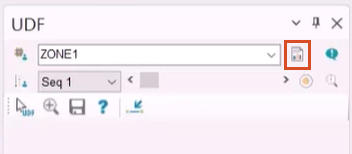
- In the Model Explorer window, switch to the UDF tab.
- With the desired zone selected in the drop-down, click Flush Zone Statistics.
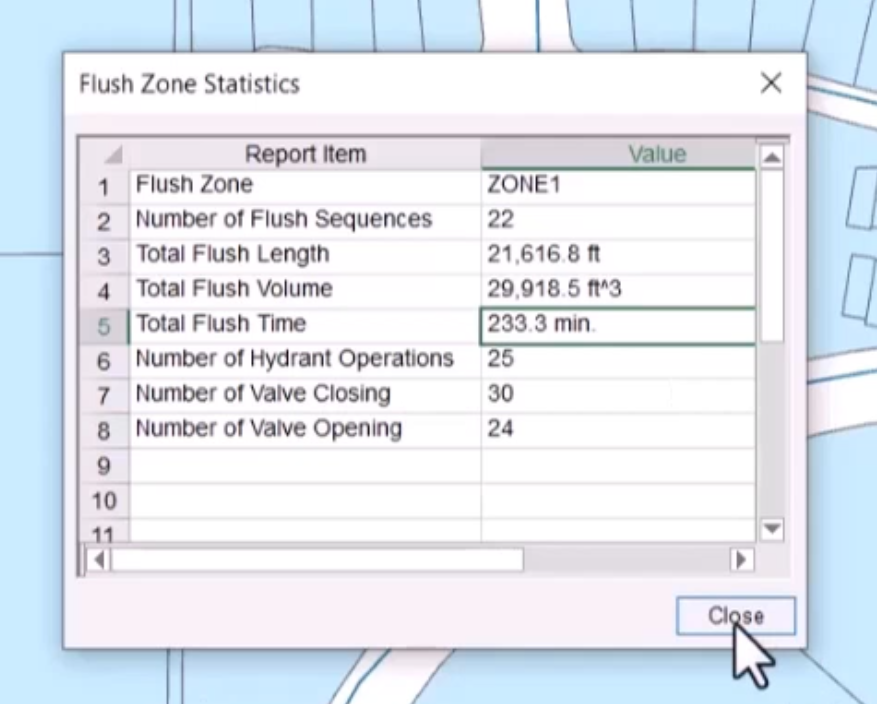
- In the Flush Zone Statistics dialog box, view the results data.
- Click Close.
To notify customers within a certain area about flushing operations and their potential impacts:
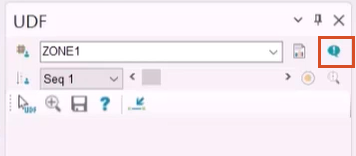
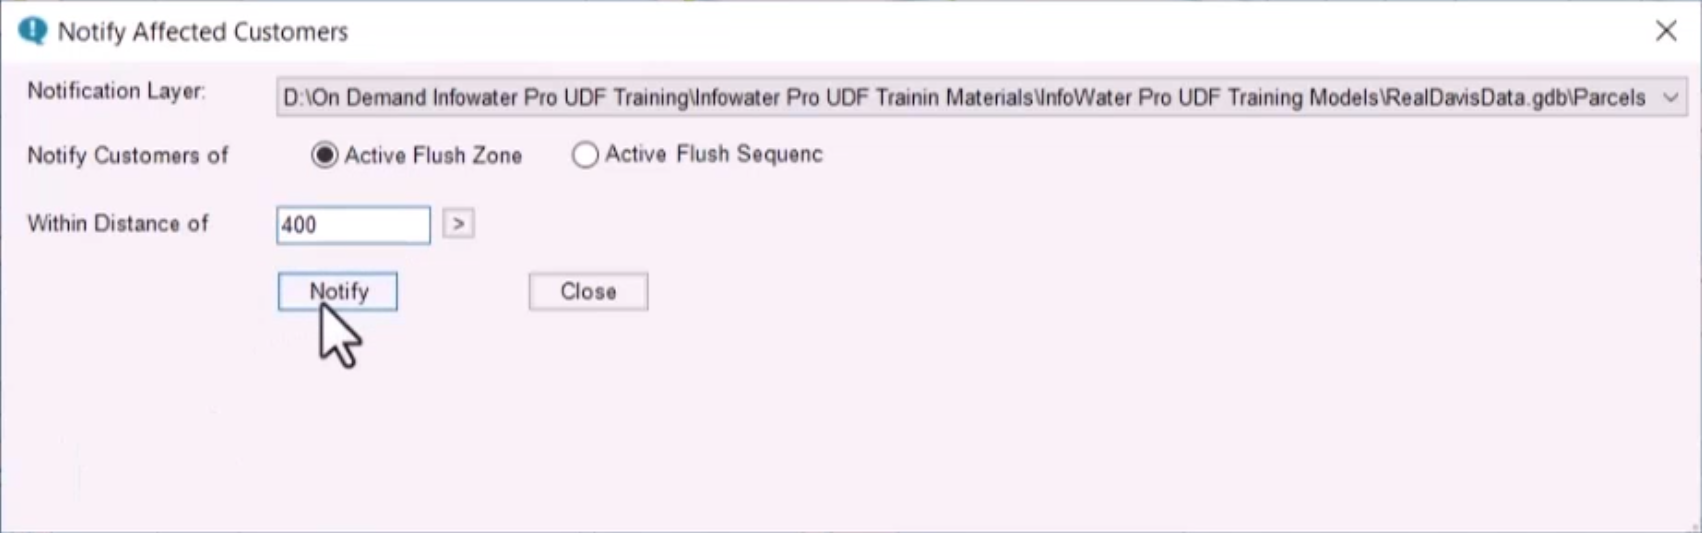
- From the UDF tab, click Notify Affected Customers.
- In the Notify Affected Customers dialog box, select a notification layer.
- Choose to notify customers within an Active Flush Zone or an Active Flush Sequence.
- Customize the radius of the notification area. In this example, the Within Distance of value is set to 400 feet.
- Click Notify.
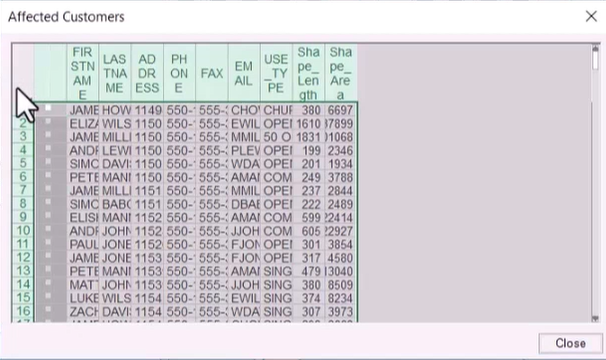
An Affected Customers window opens, with a list of customer names, addresses, phone numbers, and other contact information.
To copy the Affected Customers list to a spreadsheet:
- Click the top-left cell to highlight the entire table.
- Press CTRL+C to copy the contents.
- Press CTRL+V to paste the contents to the desired location, such as an Excel spreadsheet.
- Click Close to exit both open dialog boxes.
To zoom to the area containing affected customers:
- In the map, right-click and select Zoom To.