Identifying pump requirements
Identify the requirements of a pump and pump curve.
Tutorial resources
These downloadable resources will be used to complete this tutorial:
Step-by-step Guide
InfoWorks WS Pro allows you to model pumps and pump curves. Pumps operate on a pump curve, which contains operating characteristics like head and power consumed. The pump curve provides a relationship between the flow, head, and electric power to determine the nominal, actual, and minimum/maximum speed curves, power curves, and efficiency curves.
This example assumes a small network modelled with a fixed head supply to the east, representing a reservoir with a top water level (TWL) of 75mAD. The TWL of the reservoir does not provide enough pressure alone to supply the network. The goal is to determine how much pressure is needed to address the problem.
First, open a new transportable database:
- From the File menu, click Open > Open transportable database.
- In a file browser window, open Identifying Pump Requirements.wspt.
- From the transportable database window, right-click Pump Station Model and select Copy.
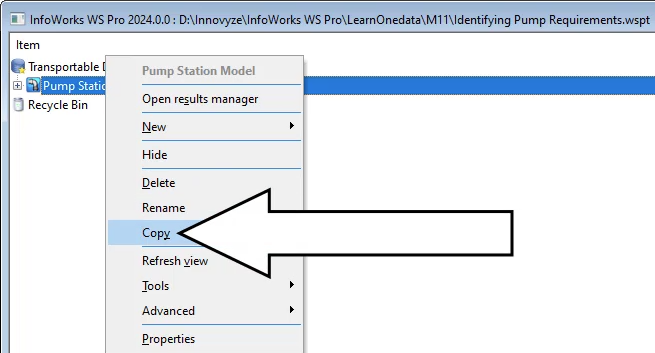
- In the Model Group window, right-click Database and select Paste: Pump Station Model(with children).
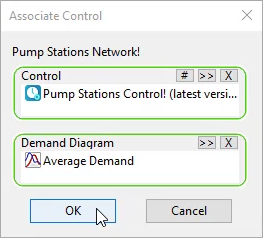
- Right-click Pump Stations Network and select Associate control.
- Drag the Pump Stations Control into the Associate Control dialog box and drop it in the Control group box.
- From the Model Group window, under Demand Diagram Group, drag Pump Stations Average Demand into the Associate Control dialog box and drop it in the Demand group box.
- Click OK.
- From the Model Group window, drag-and-drop Pump Stations Network into the workspace to open the GeoPlan.
To run the model and see the results:
- In the Model Group window, right-click Pump Station Model and select New > Run Group.
- Click OK to accept the default name.
- Right-click Run Group and select New > Run.
- In the Schedule Hydraulic Run dialog box, in the Title field, type “Base”.
- From the Model Group window, drag Pump Stations Network into the Schedule Hydraulic Run dialog box and drop in the Network group box.
- Click Run.

Next, create a long section:
- From the Model Group window, drag-and-drop Pump Stations Control into the GeoPlan to open the results.
- In the GeoPlan, zoom into the far-right area of the network.
- Click the link immediately downstream from the fixed head, which is represented by a blue triangle icon, to select it.
- In the Tools toolbar, click the Long section pick button.
- Click the next link downstream to select it.
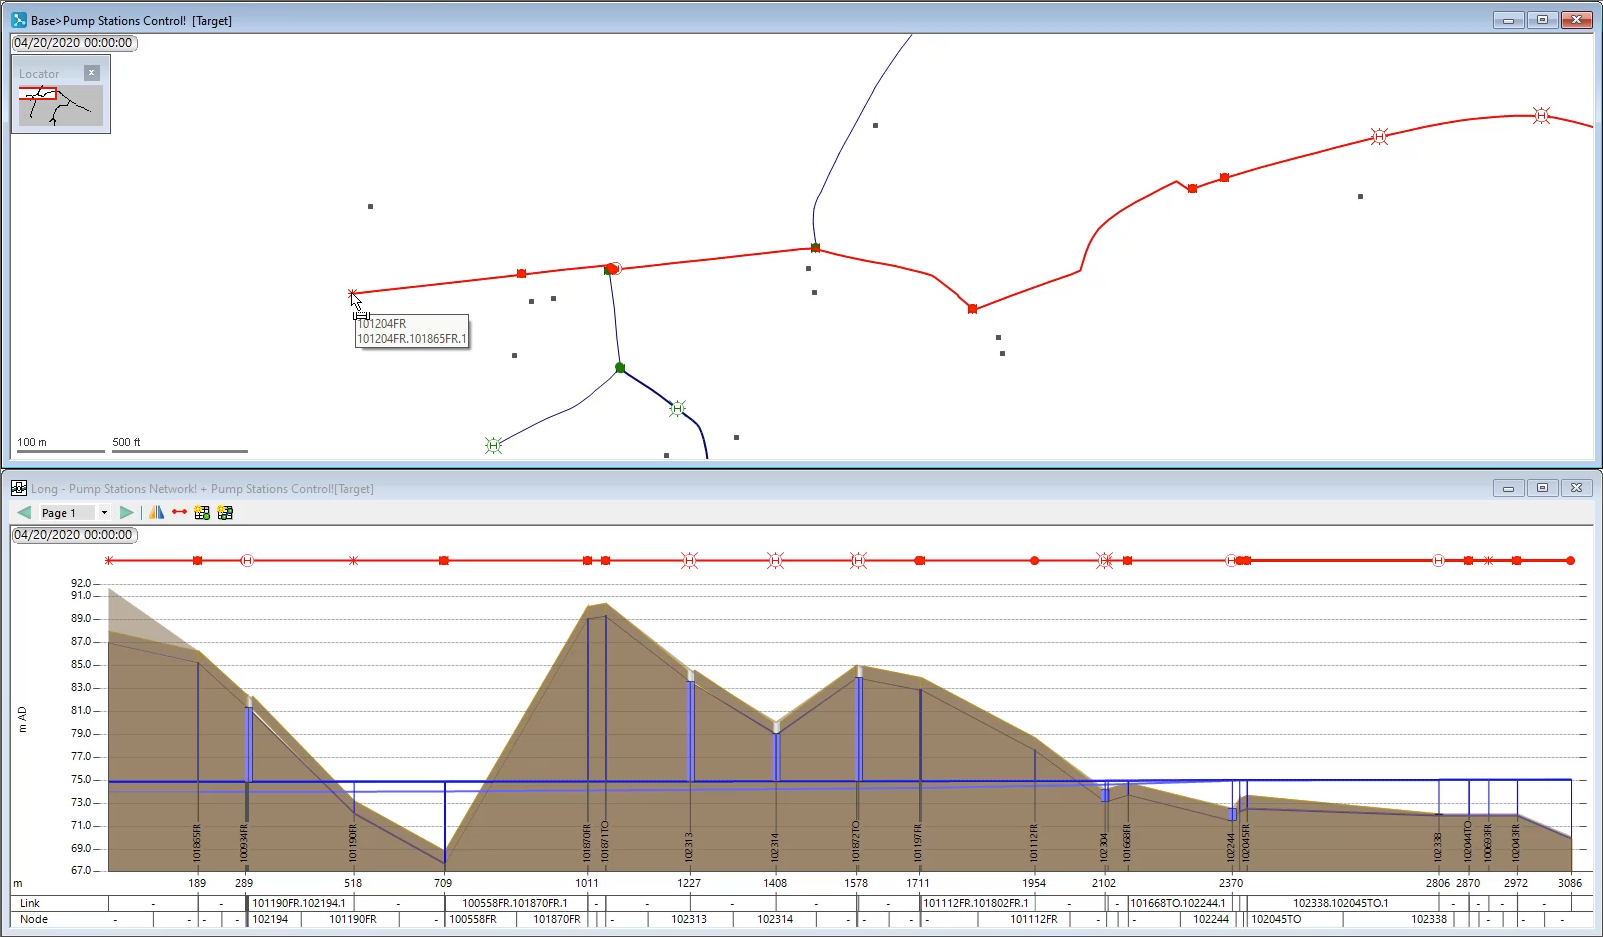
The long section appears below the model. This tool continues to trace along the network in that direction until it reaches a junction.
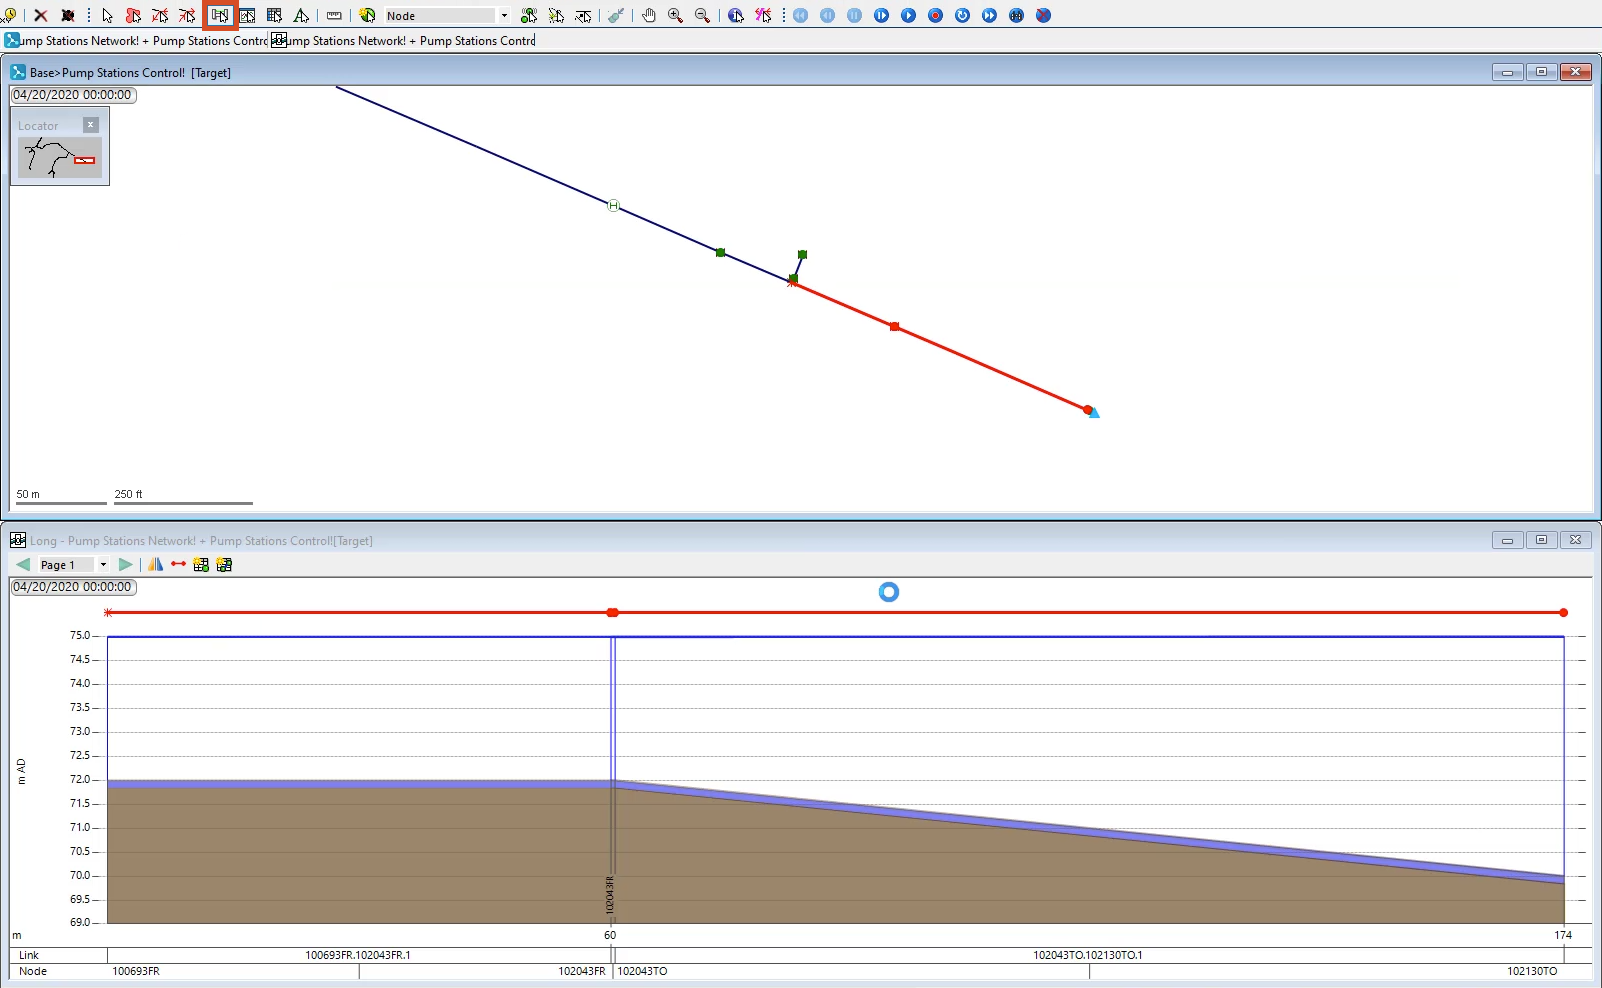
- Continue to trace the links until you reach node 101204FR.
As you click each node, the long section continues to be built.
To avoid having to manually re-trace this long section, create a new selection list:
- In the Model Group window, right-click Selection List Group and pick New > Selection List.
- In the New Name – Selection List dialog box, enter a name.
- Click OK.
- Alternatively, after tracing the desired section, in the Tools toolbar, click the Long section pick button.
- In the Tools toolbar, click the Select button.
- Click a blank area in the GeoPlan to deselect the long section.
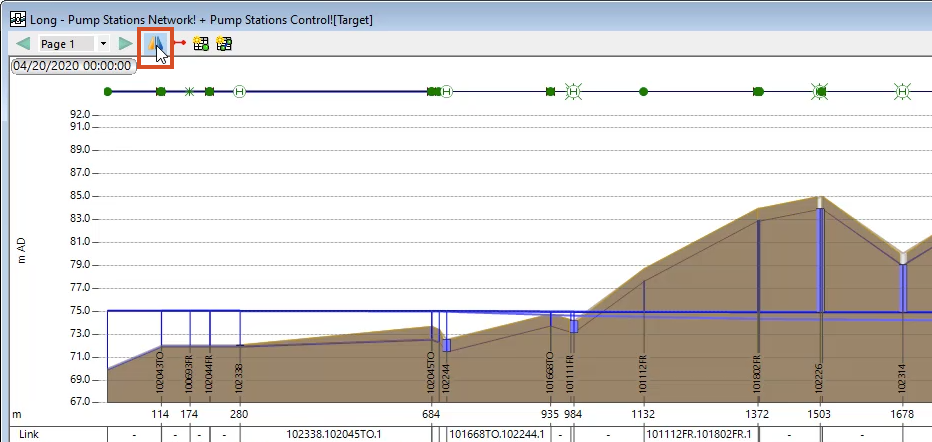
In the long section window, the hydraulic profile reads from right to left, with the fixed head on the right.
- To switch to a left-to-right view, click the Flip view button.
To open more display options for the long section window:
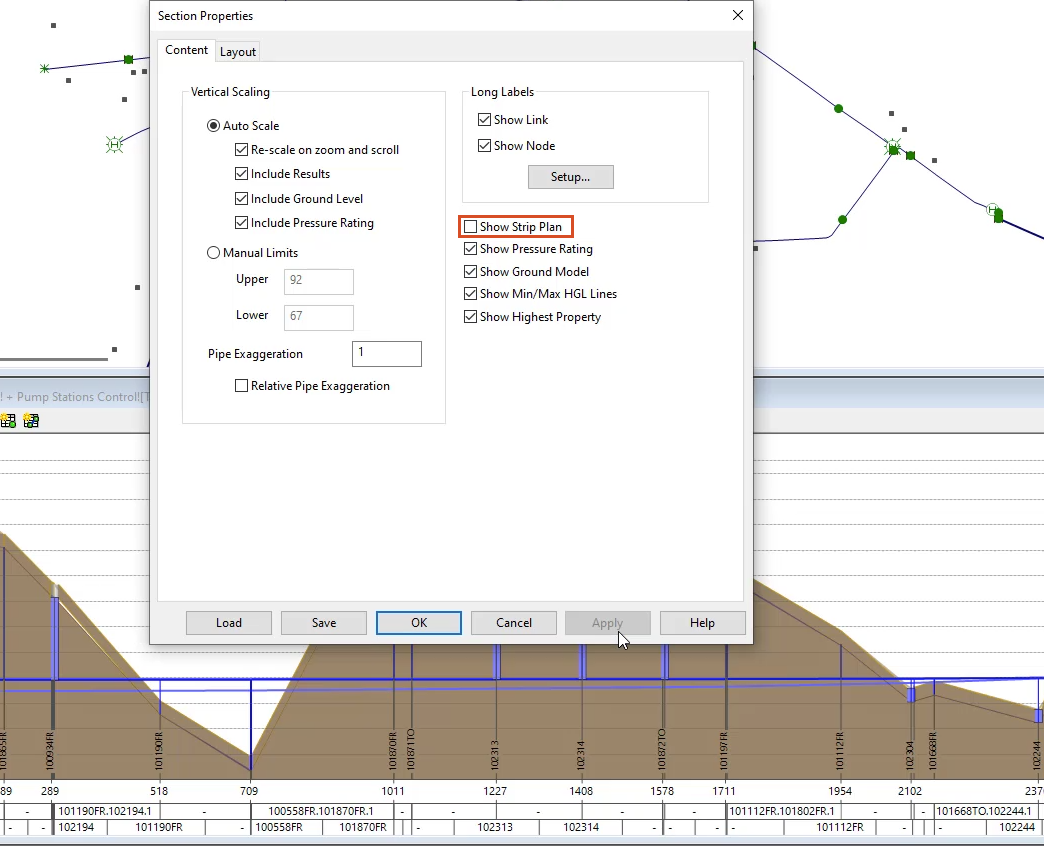
- Right-click an empty part of the window and select Properties.
The Section Properties dialog box includes several customizable fields, including scaling, labels, typeface, and colors. For example, the strip plan is the line with icons representing the different objects and nodes along the section path.
- In the Content tab, deselect Show Strip Plan.
- Click Apply.
The strip plan disappears from the top of the long section window.
To turn the strip plan back on:
- Enable Show Strip Plan.
- Click Apply.
Tip: Use the Graph tool and click the strip plan icons to graph their results.
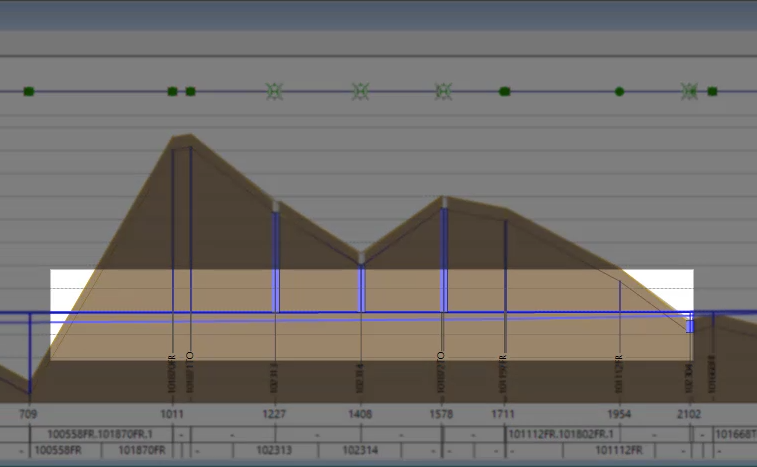
In the long section window, the blue hydraulic grade line shows insufficient water supply in the network, represented in areas where the grade line is below ground level. This information is useful for designing a pump curve and determining the characteristics of your pump station.
