Creating a pump curve and pump
Create a pump curve and add a pump to the model.
Tutorial resources
These downloadable resources will be used to complete this tutorial:
Step-by-step Guide
Pumps are widely used in water supply systems, so modelling them in InfoWorks WS Pro is vital. A Pump operates on a pump curve, which governs a pump’s operating characteristics.
In this example, there is a pressure deficit in a small network. Calculations are done for the pump RPM, duty head, and duty flow required to address the issue. The next step is to add a pump curve and a pump to the network.
First, create a new scenario:
- In the Scenarios toolbar, click Create scenario.
- In the Create New Scenario dialog box, type the name “Pump1”.
- Click OK.
Next, add a pump curve:
- In the Windows toolbar, expand the Grid windows drop-down and click New links window.
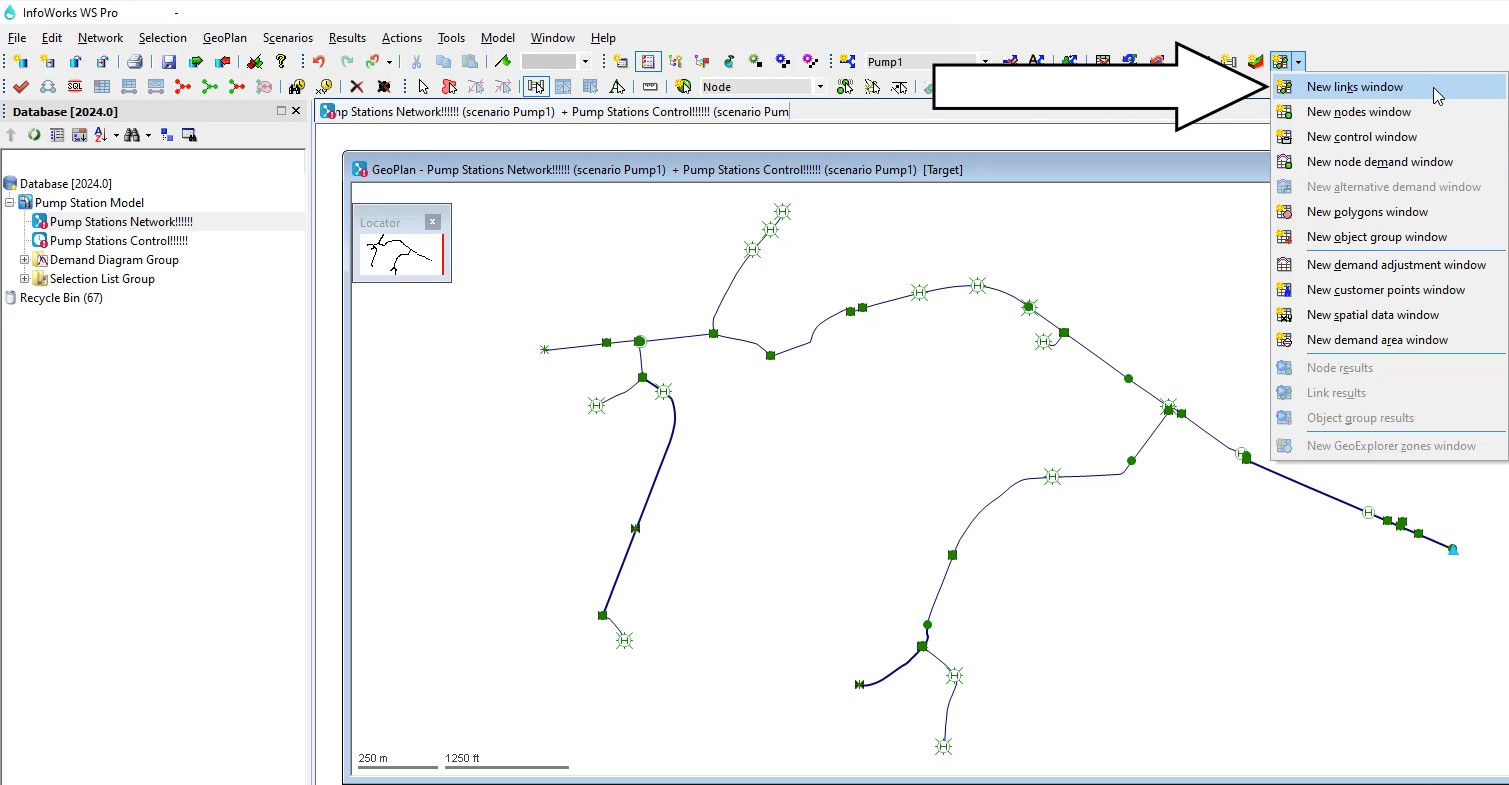
- OR, in the Window menu, select Grid windows > New links window.
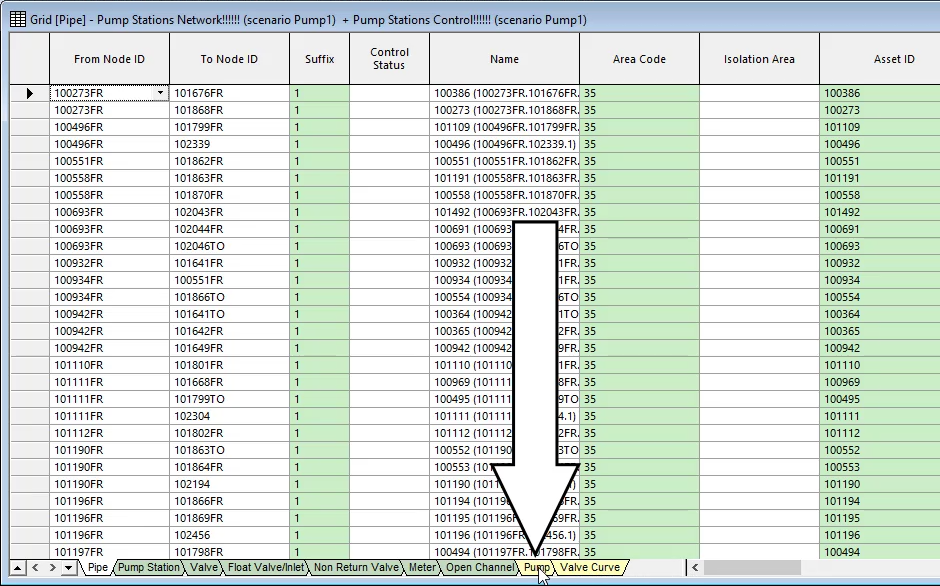
A grid opens with tabs along the bottom. Green tabs contain network objects and yellow tabs indicate data objects.
- Click the Pump tab.
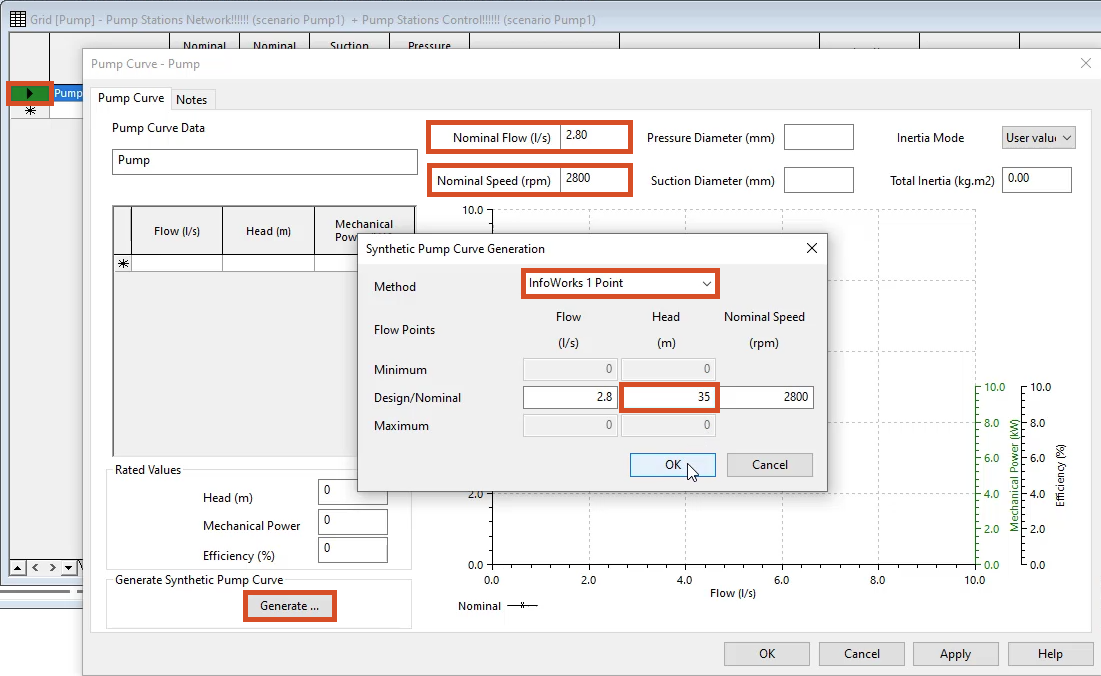
- In the first row of the Pump ID column, enter “Pump”.
- In the cell to the left of “Pump”, double-click to open the Pump Curve page.
- On the Pump Curve page, enter a Nominal Speed value of “2800”.
- Enter a Nominal Flow (l/s) value of “2.8”.
- In the Generate Synthetic Pump Curve group box, click the Generate button.
- In the Synthetic Pump Curve Generation dialog box, expand the Method drop-down and select InfoWorks 1 Point, if it is not selected.
- In the Design/Nominal row, Head (m) column, enter a value of “35”.
- Click OK.
The Pump Curve page updates to display the generated pump curve.
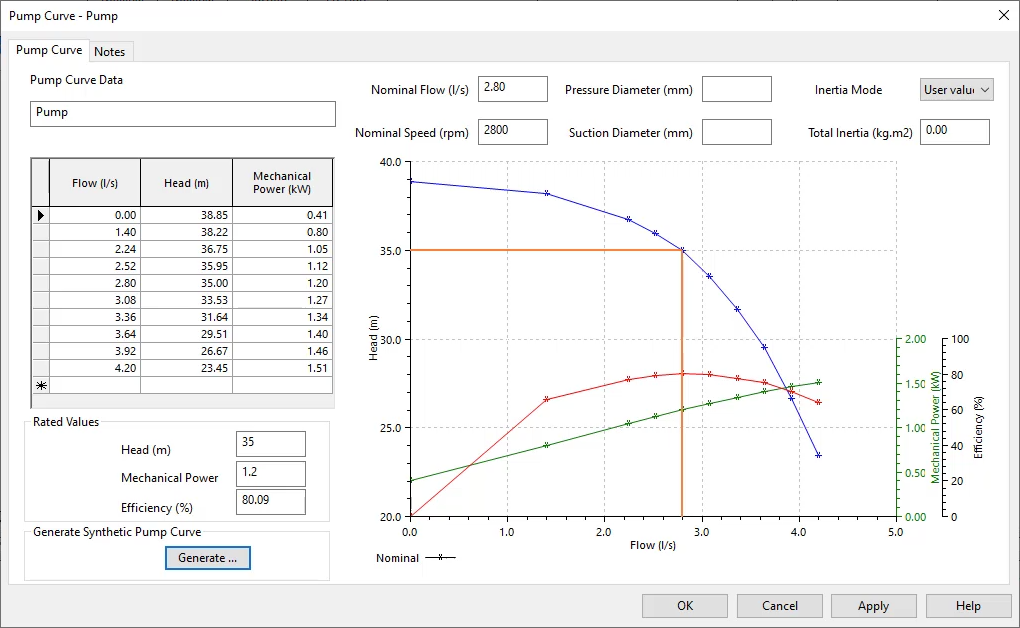
- Click OK.
- Close the grid window.
Next, add the pump station to the model:
- In the GeoPlan, zoom into the right side of the network.
- Double-click the short pipe with asset ID 102130, immediately downstream from the fixed head.
- In the Properties panel toolbar, click Change type.
- In the Change Object Type dialog box, select Pump Station.
- Click OK.
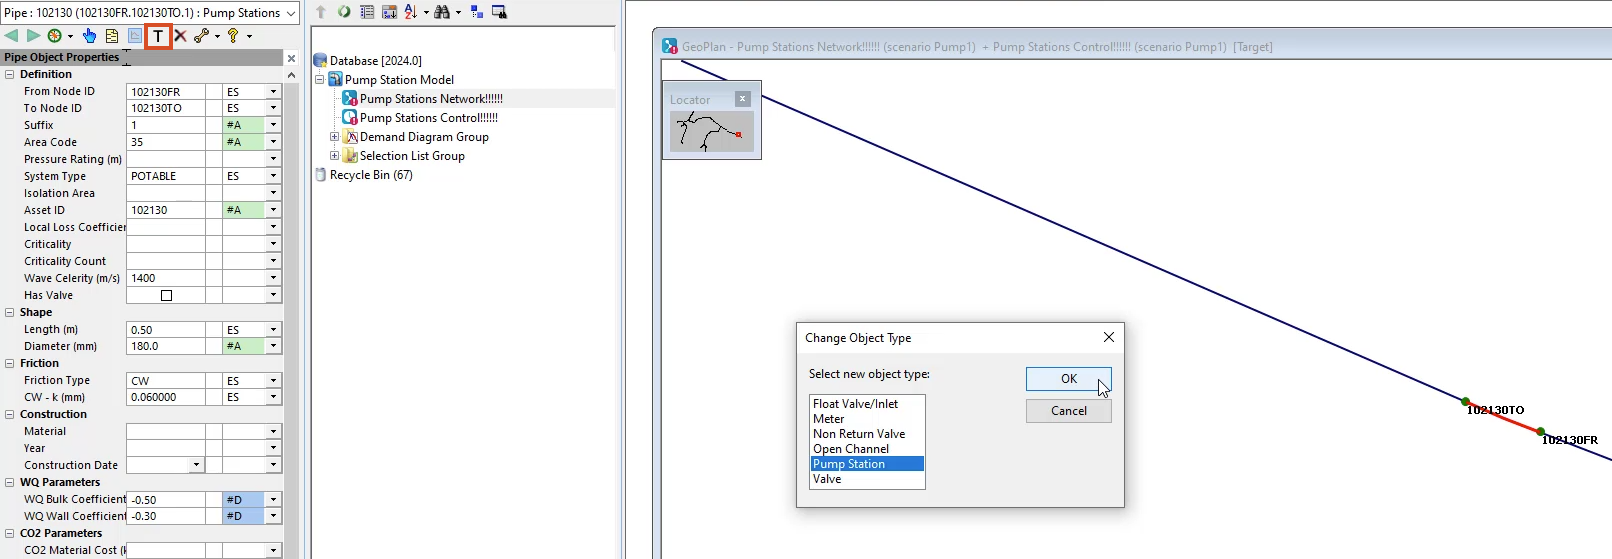
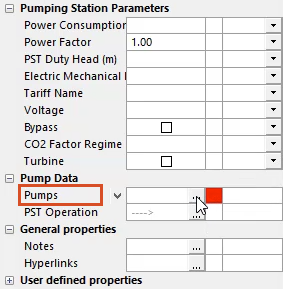
A red warning box appears in the Pumps row, because the created pump station needs at least one pump.
- In the Pumps row, click the More (…) button.
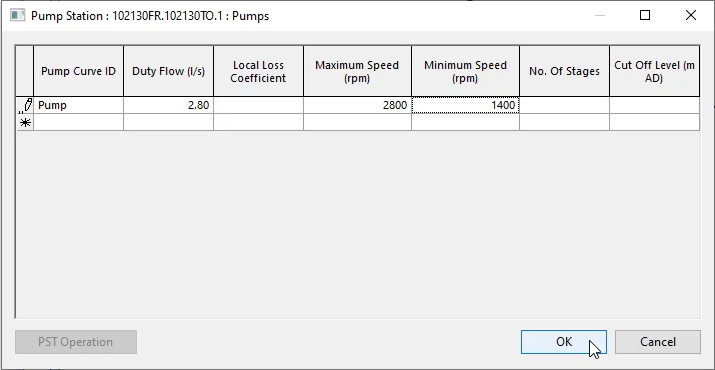
- On the Pumps page, in the first row of the Pump Curve ID column, expand the drop-down and select Pump.
- For Duty Flow (i/s), enter a value of “2.80”.
- Set the Maximum Speed (rpm) to “2800”.
- Set the Minimum Speed (rpm) to “1400”.
- Click OK.
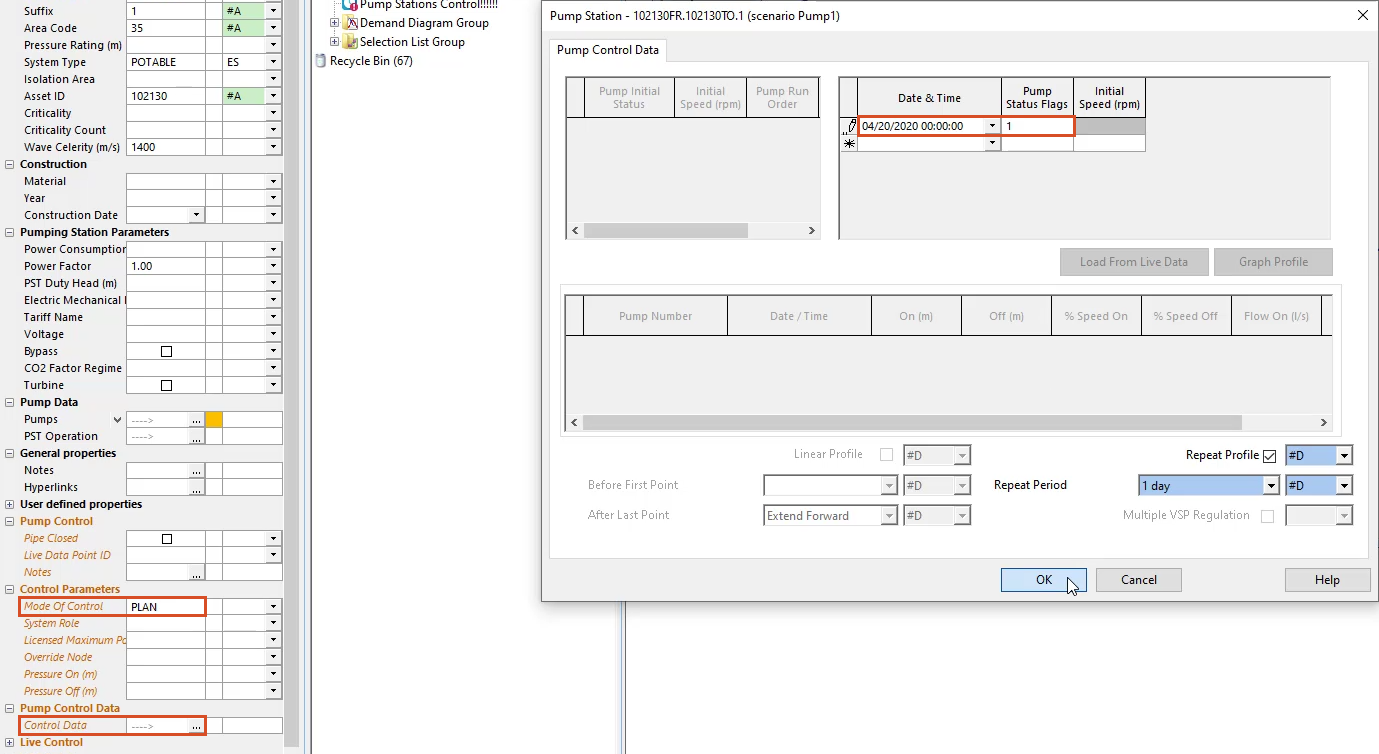
- In the Properties panel, under Control Parameters, expand the Mode of Control drop-down and select PLAN (units).
- Under Pump Control Data, in the Control Data row, click the More (…) button.
- On the Pump Control Data page, set the Date & Time to April 20, 2020 at 00:00:00 in the proper date format for your region.
- Set Pump Status Flags to 1.
- Click OK.
- Commit all changes to the database.
- Click Yes in the following two notifications.
- Click OK in the third notification.
Next, create a new run using the same network:
- In the Scenarios toolbar, click Create scenario.
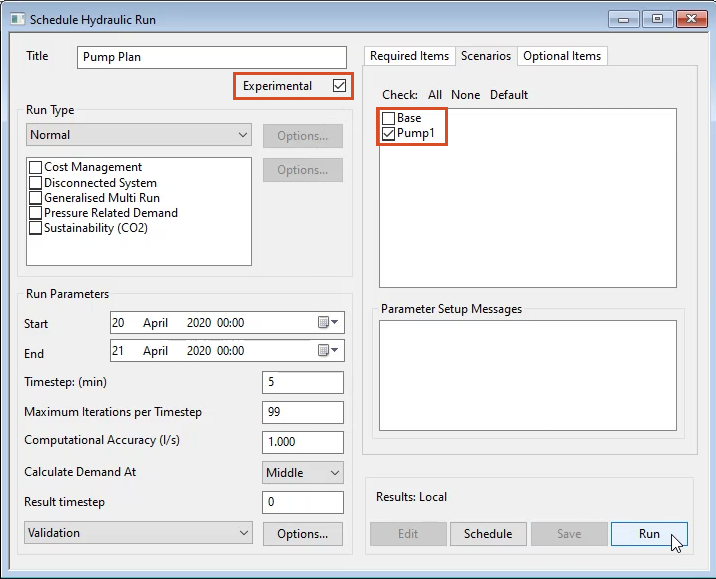
- In the Create New Scenario dialog box, enter a name for the run. In this example, the name is “Pump Plan”.
- Open the Scenarios tab.
- Make sure only Pump1 is active.
- Select Experimental.
- Click Run.
To view the results:
- Once the run is complete, from the Model Group window, under Pump Plan, drag-and-drop Pump Stations Control into the workspace.
- Zoom into the area of the network with the added pump station.
- In the Model Group window, under Selection List Group, drag-and-drop the LongSection selection list into the results GeoPlan.
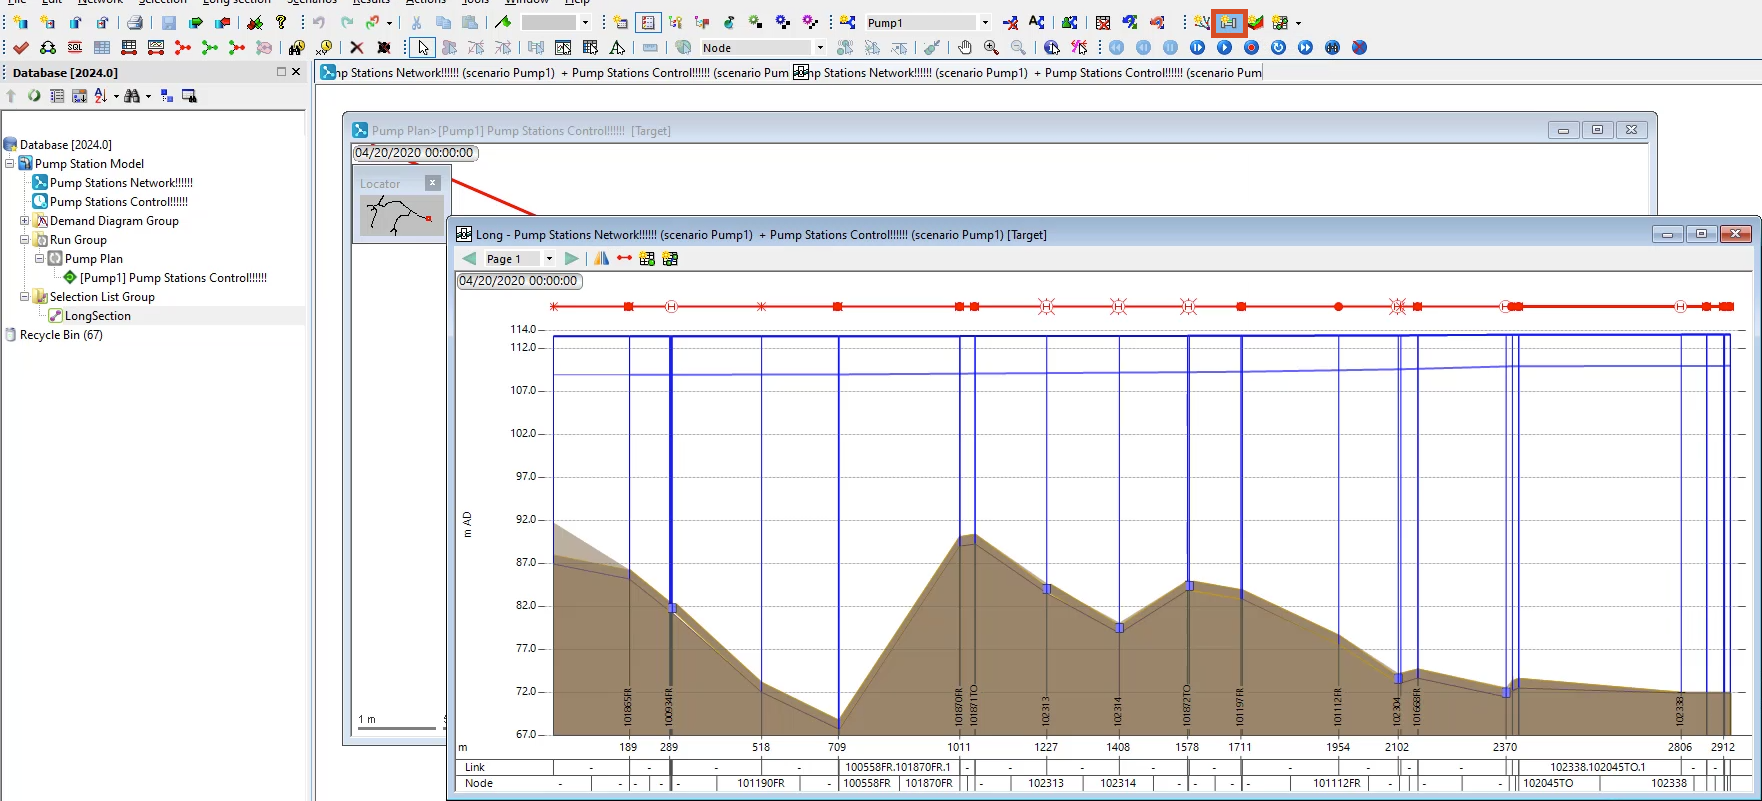
- In the Windows toolbar, click New long section.
Notice in the long section window that adding the pump station dramatically raised the hydraulic grade line, providing more than enough pressure.
