Run a surge analysis with and without a surge protection device
Run a surge analysis both with and without a surge protection device to compare the results.
Tutorial resources
These downloadable resources will be used to complete this tutorial:
Step-by-step guide
In InfoSurge Pro, the impact of surge protection devices (SPDs) can be illustrated by running a surge analysis on a pipe network both with and without an SPD. In this example, an analysis without SPDs is run. Then, a side discharge orifice is set up to view the result of mitigating pressure surge.
- Double-click the desired project .aprx file to open ArcGIS Pro.
- Click the InfoWater Pro tab to open the InfoWater Pro ribbon.
- In the Project panel, click Initialize.
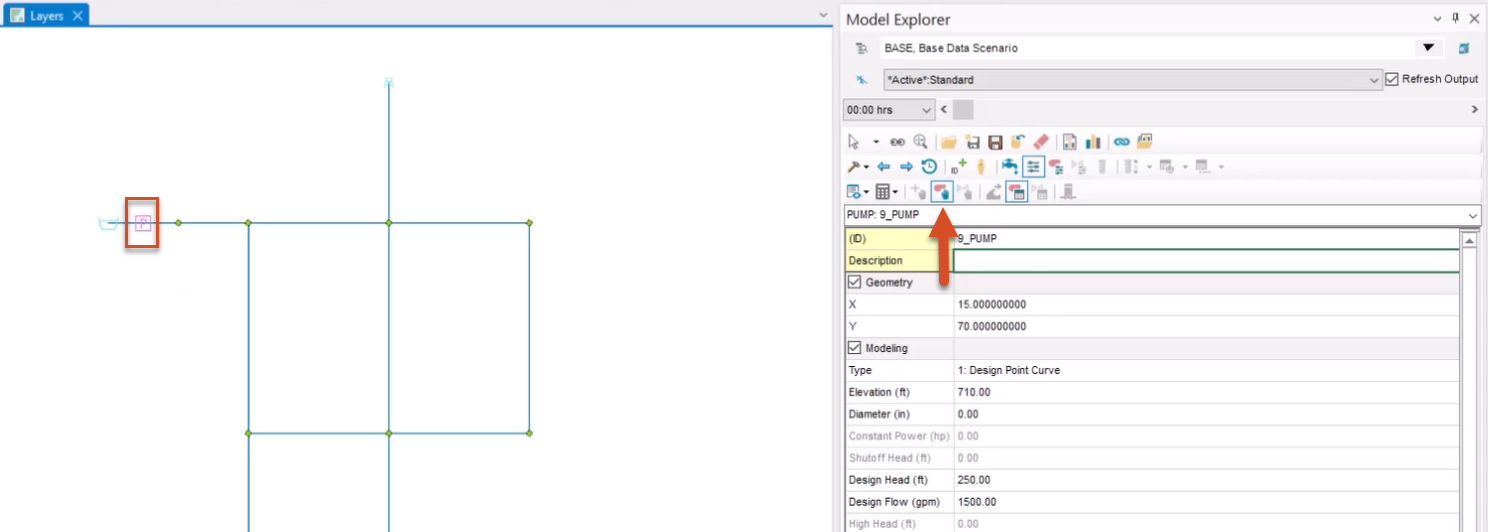
- On the map, select a pump, such as the pump with ID 9_PUMP.
- From the Model Explorer, click Pump Operation Change.
- In the Speed/Wicket Change Data dialog box, ensure that Pump Disturbance Type is enabled, and that the associated drop-down is set to 1: Trip.
- Set the Trip Start Time to 2 seconds.
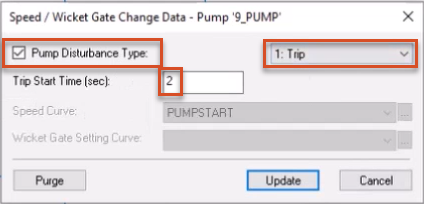
- Click Update.
This means that 2 seconds into the simulation, the pump will run down according to the data specified in the Pump Surge Data dialog box.
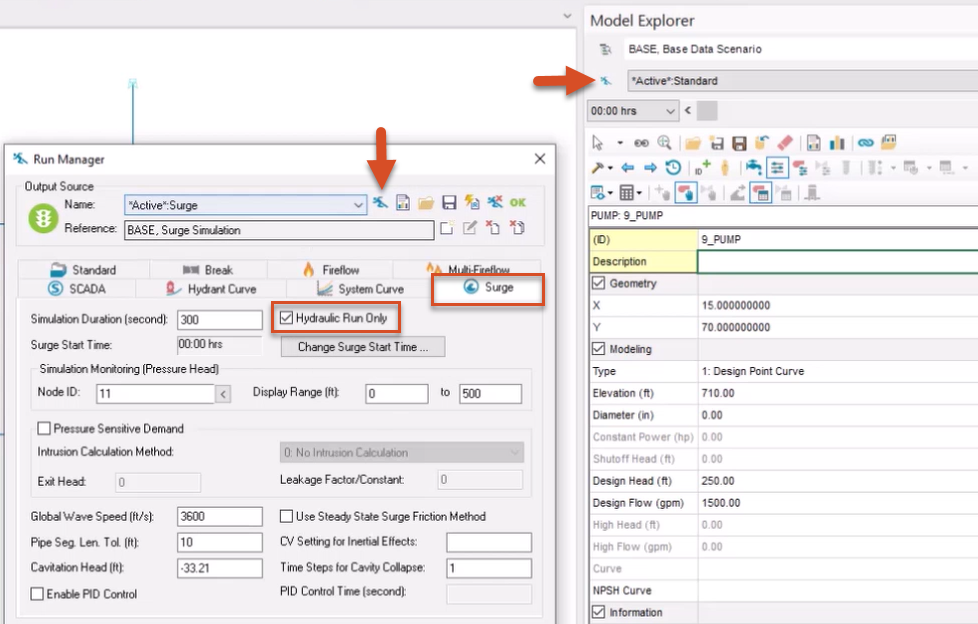
- From the Model Explorer, click Run Manager.
- In the Run Manager dialog box, switch to the Surge tab.
- Enable the Hydraulic Run Only option.
- Click Run to run the hydraulic simulation.
- When the simulation is complete, disable the Hydraulic Run Only option.
- Click Run again.
- When finished, click OK to close the Run Manager.
- If a notification appears asking to switch to the most recent run output data, click Yes.
- From the ribbon, View panel, select Report Manager.
- In the Report Manager, click New to open the Output Report/Graph dialog box.
- Under Available Output Sources, select *Active*:Surge.
- From the Graph Report tab, select Surge Node Graph.
- In the Data Scope group box, enable the Selected Element(s) < option, if it is not already.
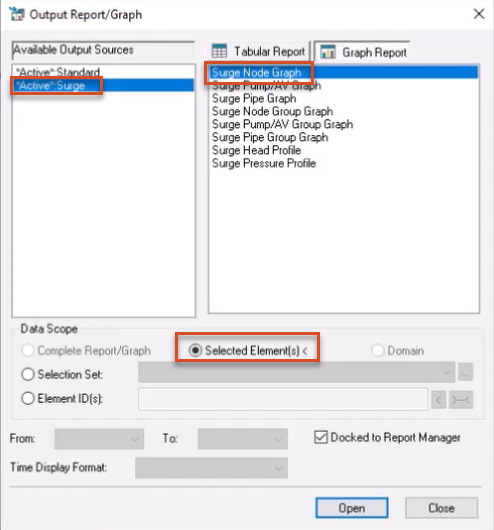
- Click Open.
- On the map, select Junction 11 to view its pressure profile in the Report Manager dialog box.
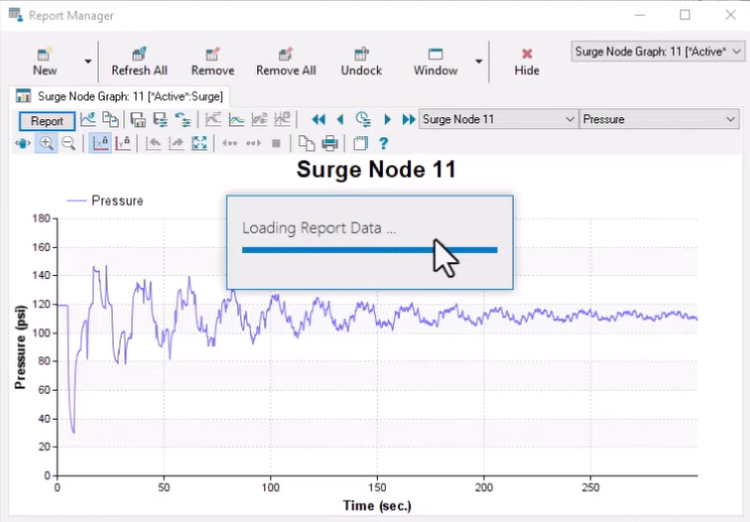
- Click Report to examine individual data points.
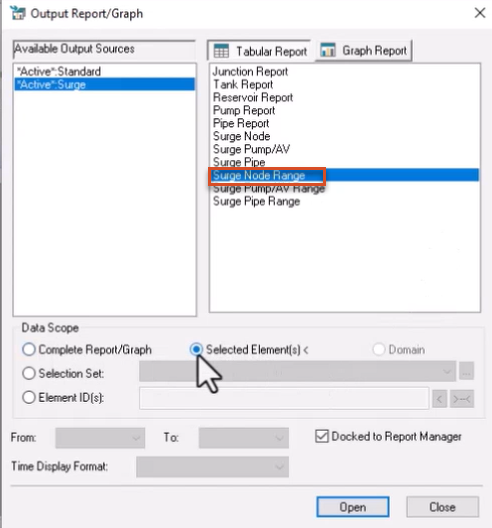
- Click New again.
- In the Output Report/Graph dialog box, open the Tabular Report tab.
- Select the Surge Node Range option.
- Ensure that the Selected Element(s) < option is enabled.
- Click Open.
- On the map, select Junction 11.
- Right-click the map and select Enter.
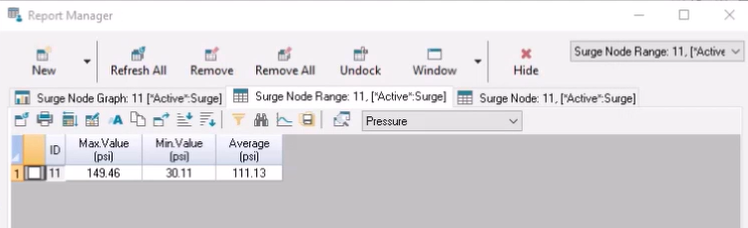
In the Report Manager dialog box, note the minimum and maximum pressures listed in the table.
- Click Hide to close the Report Manager.
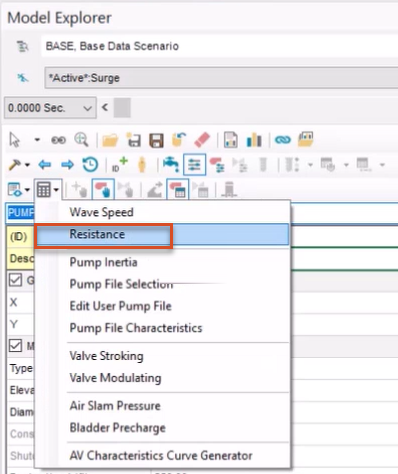
Next, set the flow resistance of an orifice to be added to the pipe network. This controls how much the element resists flow of fluid through the element and is defined as the head change divided by the flow squared across an element.
- From the Model Explorer, expand the Auxiliary Calculator drop-down and select Resistance.
- In the InfoSurge Calculator – Resistance dialog box, set the Unit to English, if it is not already.
- In the Calculate Resistance From group box, Option drop-down, select Orifice Data.
- Set the Coefficient of Discharge to 0.6.
- Set the Orifice Diameter to 5.
- Click Compute.
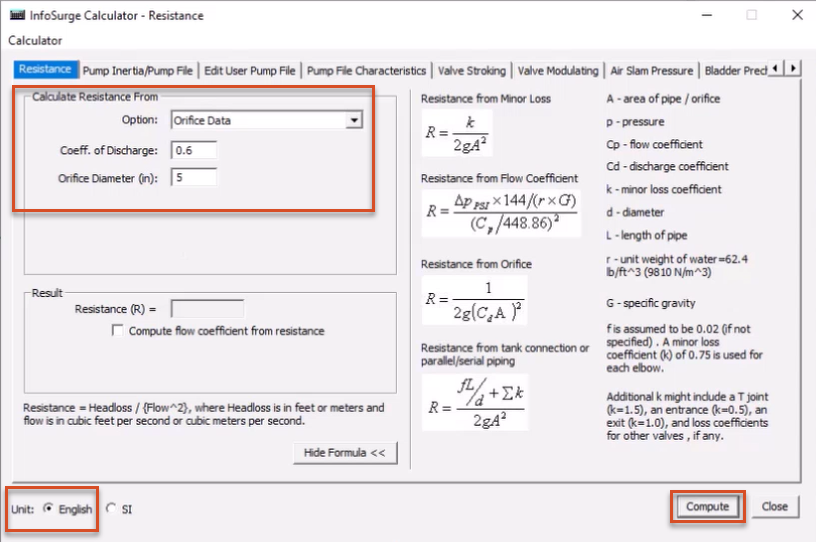
Note that in the Result group box, the Resistance (known as the R value) is calculated as 2.32091.
- Click Close.
To add a side discharge orifice to the pipe network:
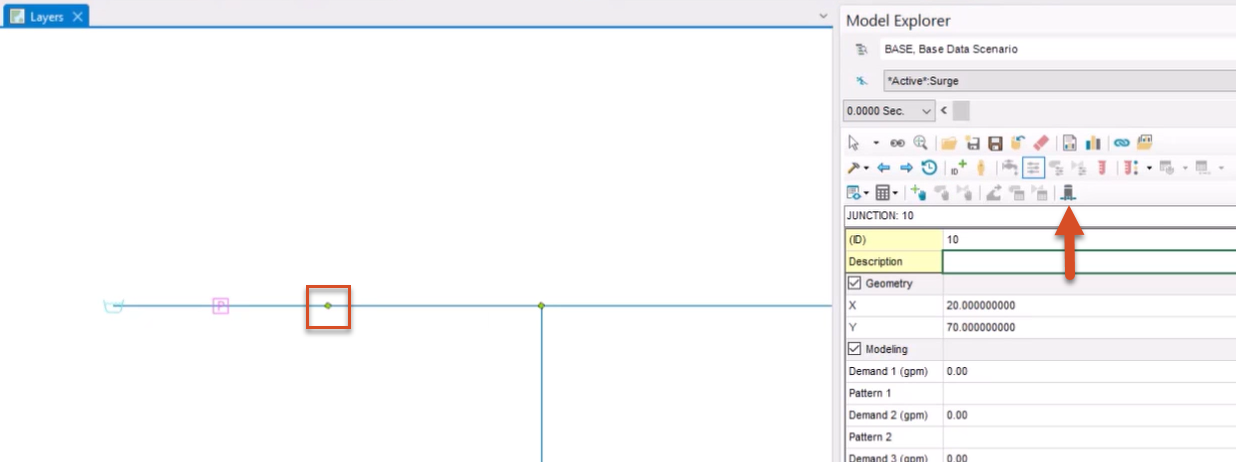
- Select Junction 10.
- From the Model Explorer, click Surge Protection Device.
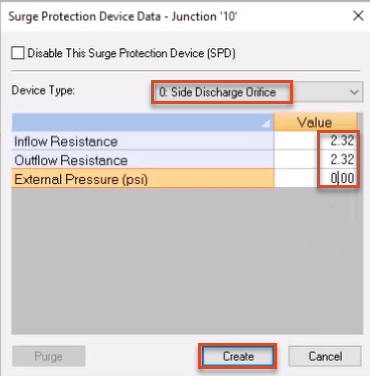
- In the Surge Protection Device Data dialog box, expand the Device Type drop-down and select 0: Side Discharge Orifice.
- For both the Inflow and Outflow Resistance, assign the calculated value, 2.32.
- Set the External (atmospheric) Pressure to 0.
- Click Create.
- Open the Run Manager and Run another surge analysis.
- Click OK.
- Reopen the Report Manager and click Refresh All to refresh the output for Junction 11 for the latest run.
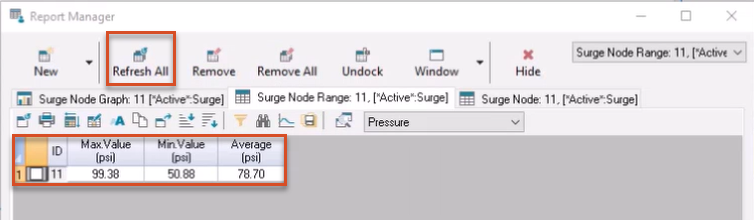
Observe how the minimum, maximum, and average pressures reflect the drastic impact of introducing a surge protection device where one did not exist previously.
- Click Hide to close the Report Manager.