Using 2D results objects and results analysis objects
Use results analysis objects to interrogate 2D results objects.
Tutorial resources
These downloadable resources will be used to complete this tutorial:
Step-by-step guide
With a set of results loaded onto the GeoPlan, 2D results analysis objects can be used to interrogate larger groups of elements within a 2D mesh.
2D results analysis objects—2D results polygons, results sections, and 2D results points—can be extremely useful for high-level results investigations.
Once created, results analysis objects can be saved as results analysis items for use on different sets of results. Calculations are undertaken using time-varying element results, so they should be used with caution.
For accurate results, especially relating to flows, Network results objects (2D) should be used, but they must be built into the mesh prior to simulation.
- From the File menu, select Open > Open transportable database.
- Navigate to and select the .icmt file.
- Click Open.
- If a popup displays about opening the database as read-only, click Yes.
- Right-click the top-level folder and select Copy.
- In the popup, click Continue.
- In the Explorer window, right-click the Database and select Paste (with children).
- In the Copying popup, enable Copy simulation results.
- Click Continue.
- For this example, open 2D Dam Breach on the GeoPlan, to ensure the model opens with the simulation results applied.
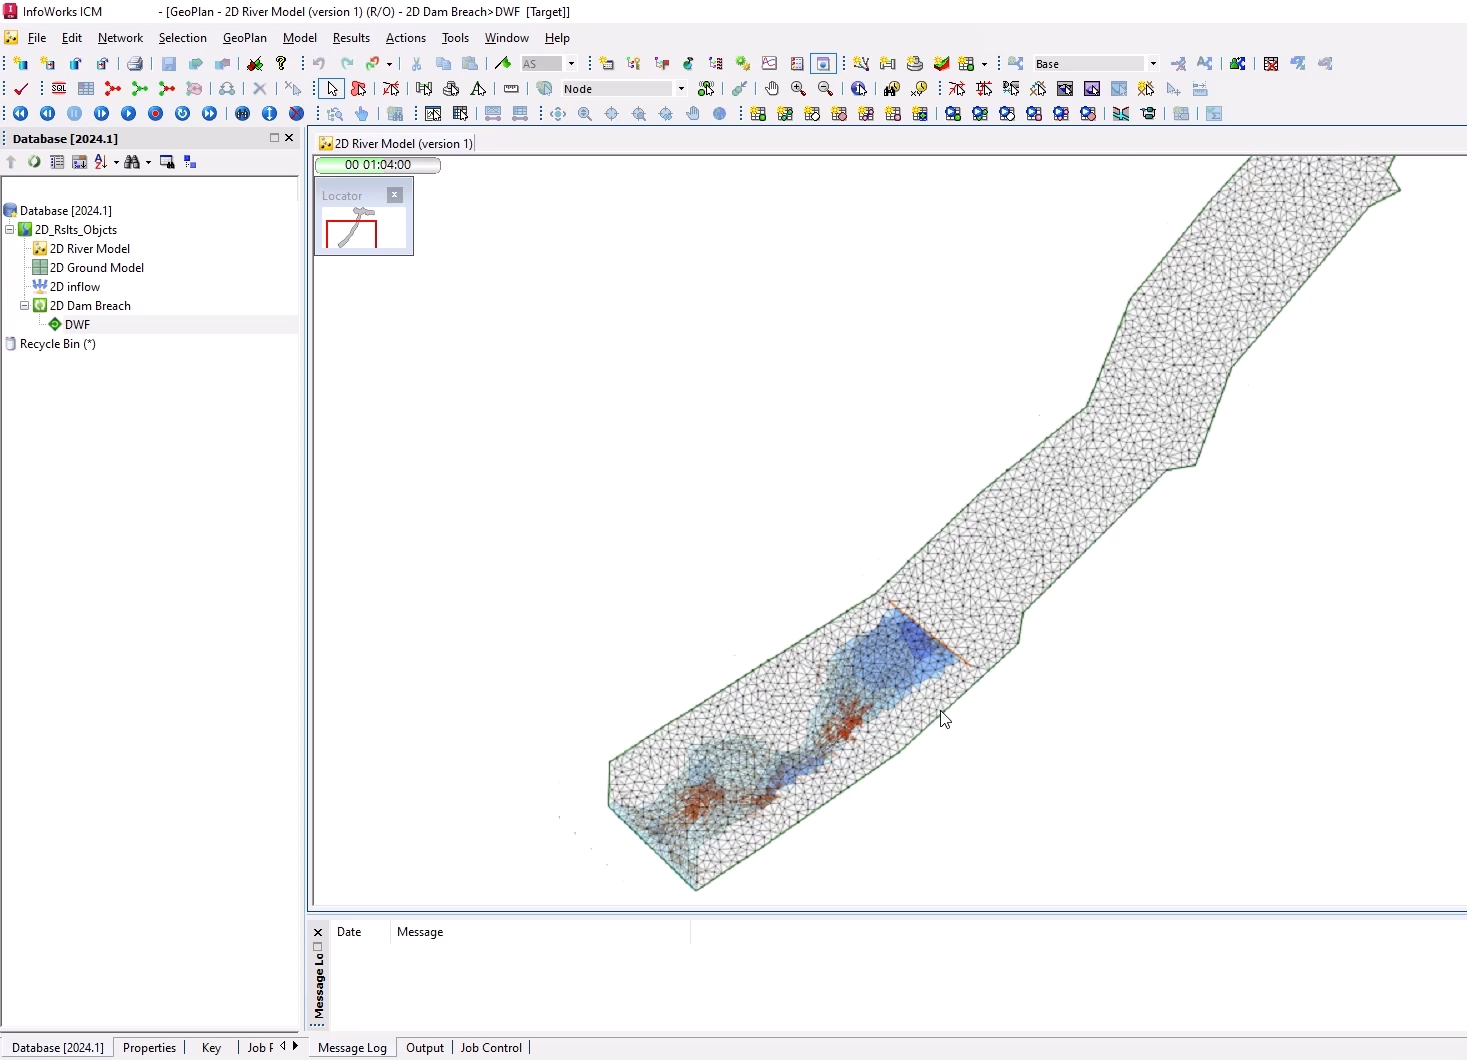
- Progress the simulation to the point before the structure fails.
- Zoom into that area.
First, create a 2D results polygon:
- In the GeoPlan Tools toolbar, expand the New Object Type drop-down and select Polygon.
- Zoom out for a clear view of the water approaching the dam.
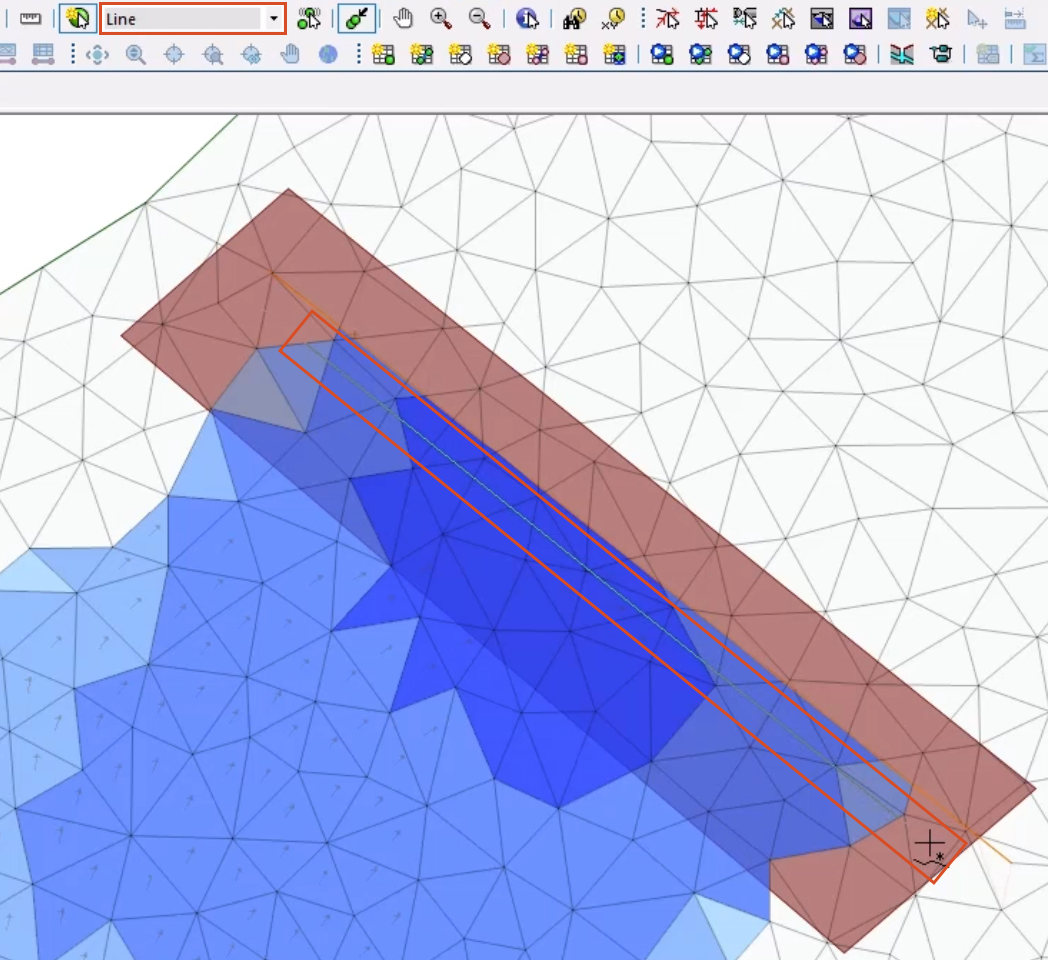
- Click to create a polygon around an area of the water and the dam.
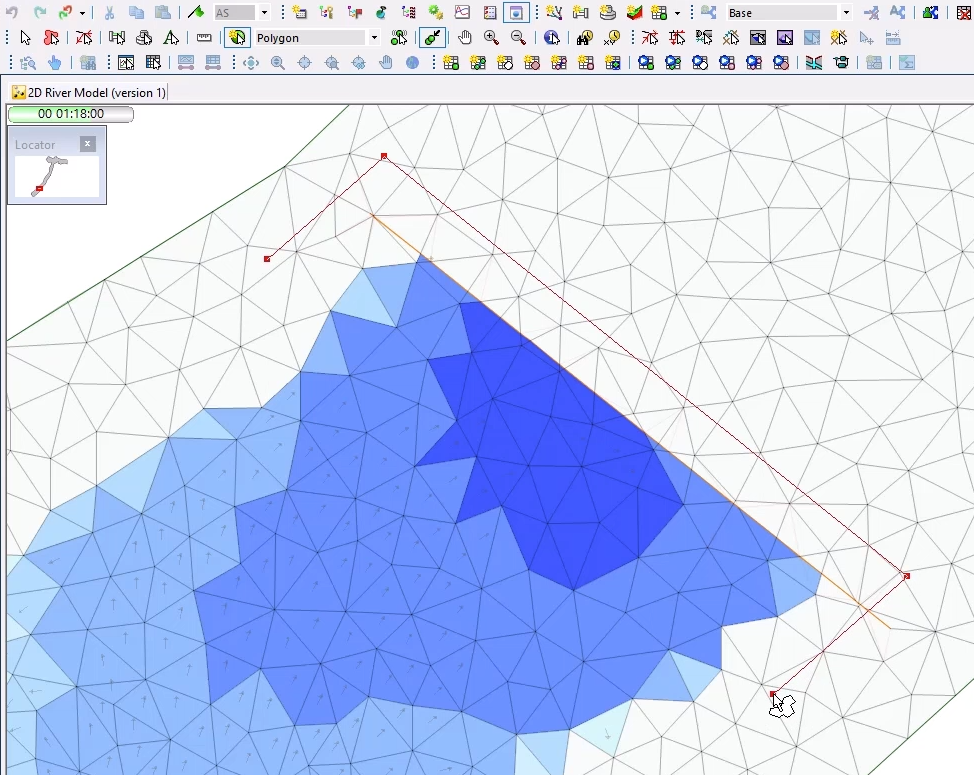
- Double-click to close the polygon.
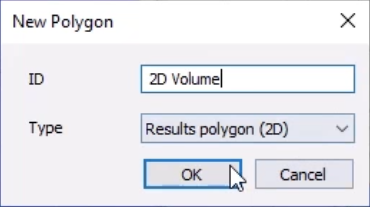
- In the New Polygon dialog box, ID field, type “2D Volume”.
- Click OK.
To create a results section:
- In the New Object Type drop-down, select Line.
- Draw a line along the dam on the upstream side.
- In the New Line dialog box, in the Name field, type “2D Collapse”.
- Click OK.
To use some of the graphing tools to look at the results:
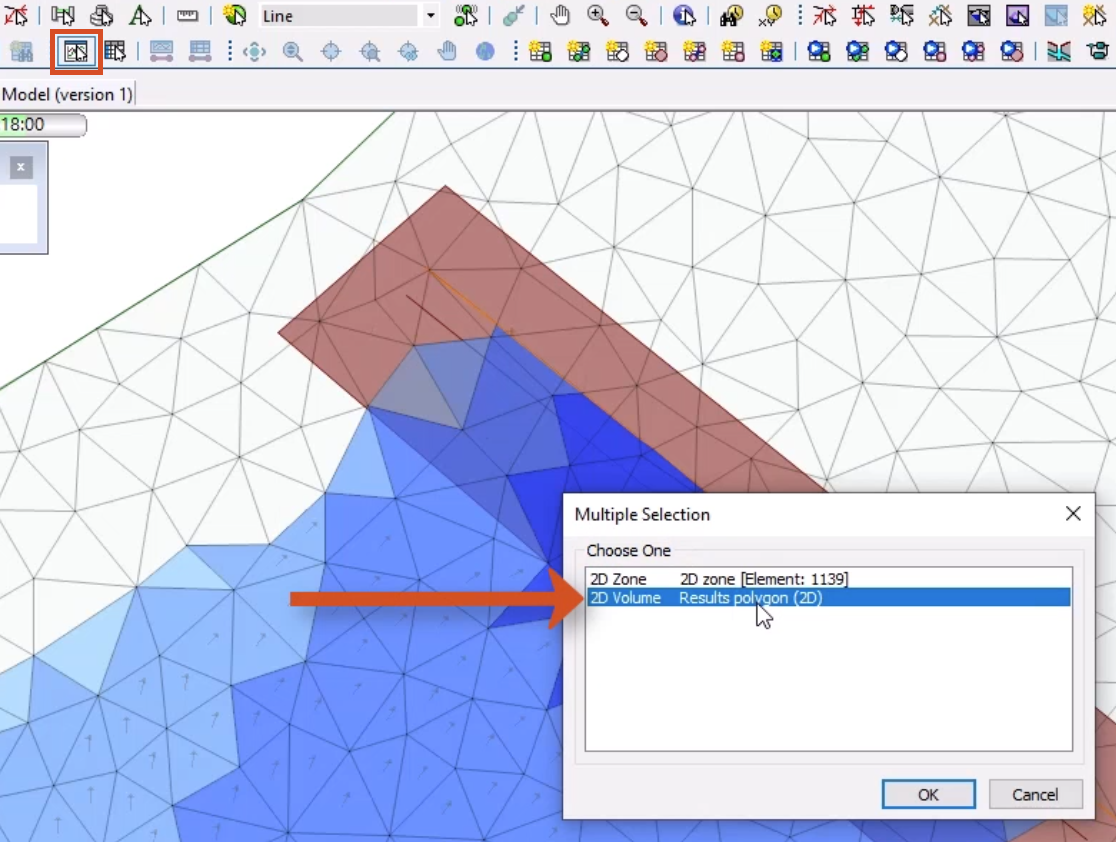
- In the Results toolbar, select Graph Pick.
- On the 2D River Model, click inside the polygon.
- In the Multiple Selection popup, select 2D Volume Results polygon (2D).
- Click OK.
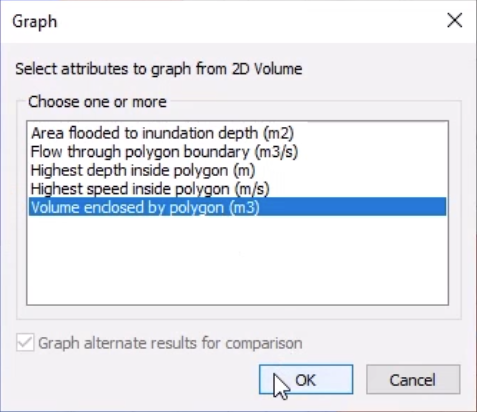
- In the Graph dialog box, select Volume enclosed by polygon (m3).
- Click OK.
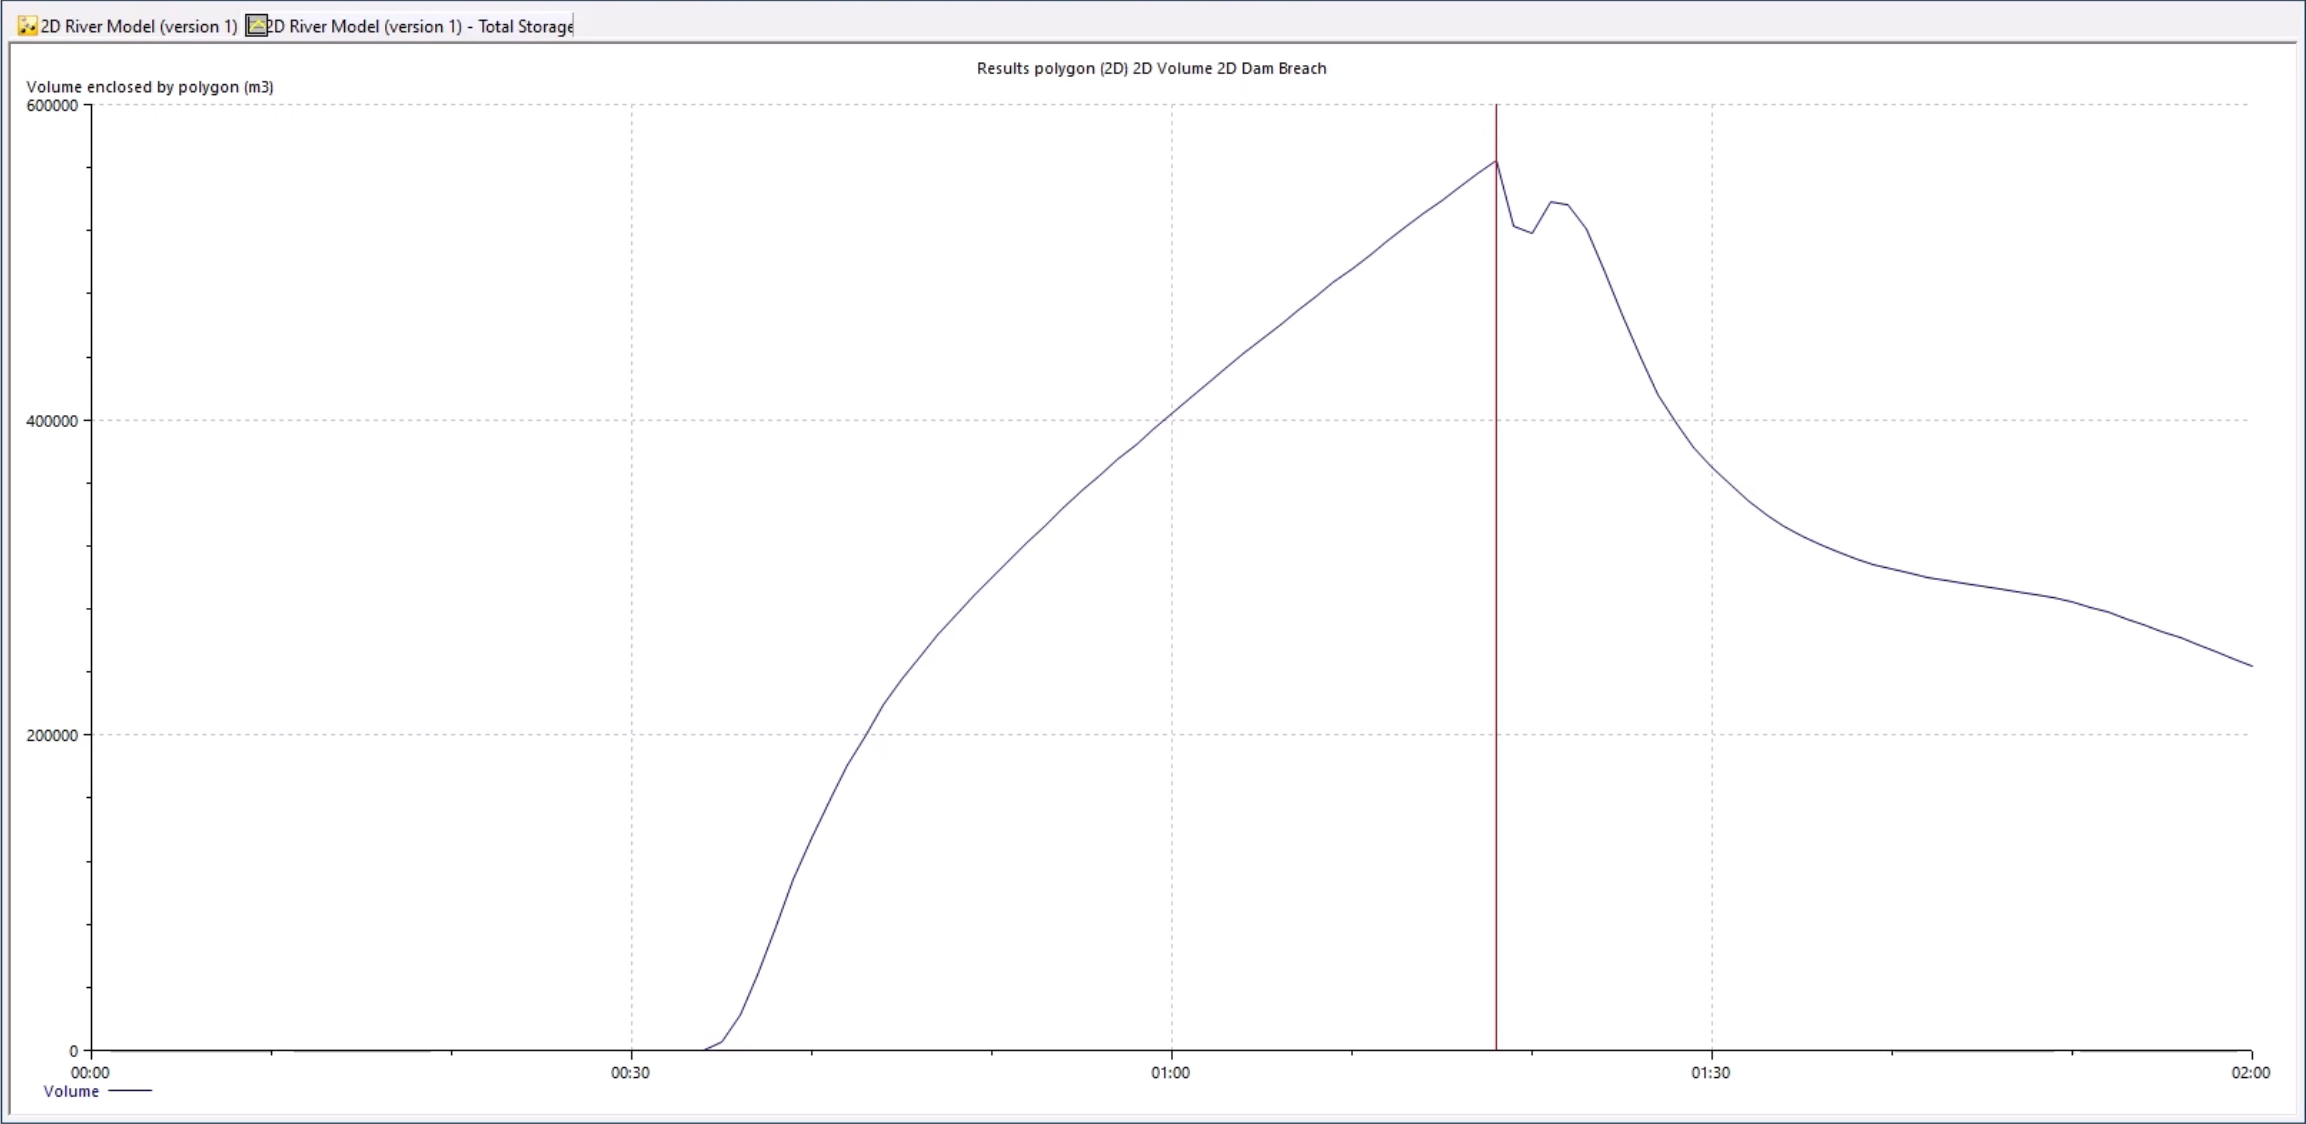
A 2D River Model graph window displays the maximum volume contained by the structure prior to collapse.
- Close the graph window tab.
- With the Graph Pick on, click the results section line just drawn.
- In the Multiple Selection dialog box, choose 2D Collapse Results section.
- Click OK.
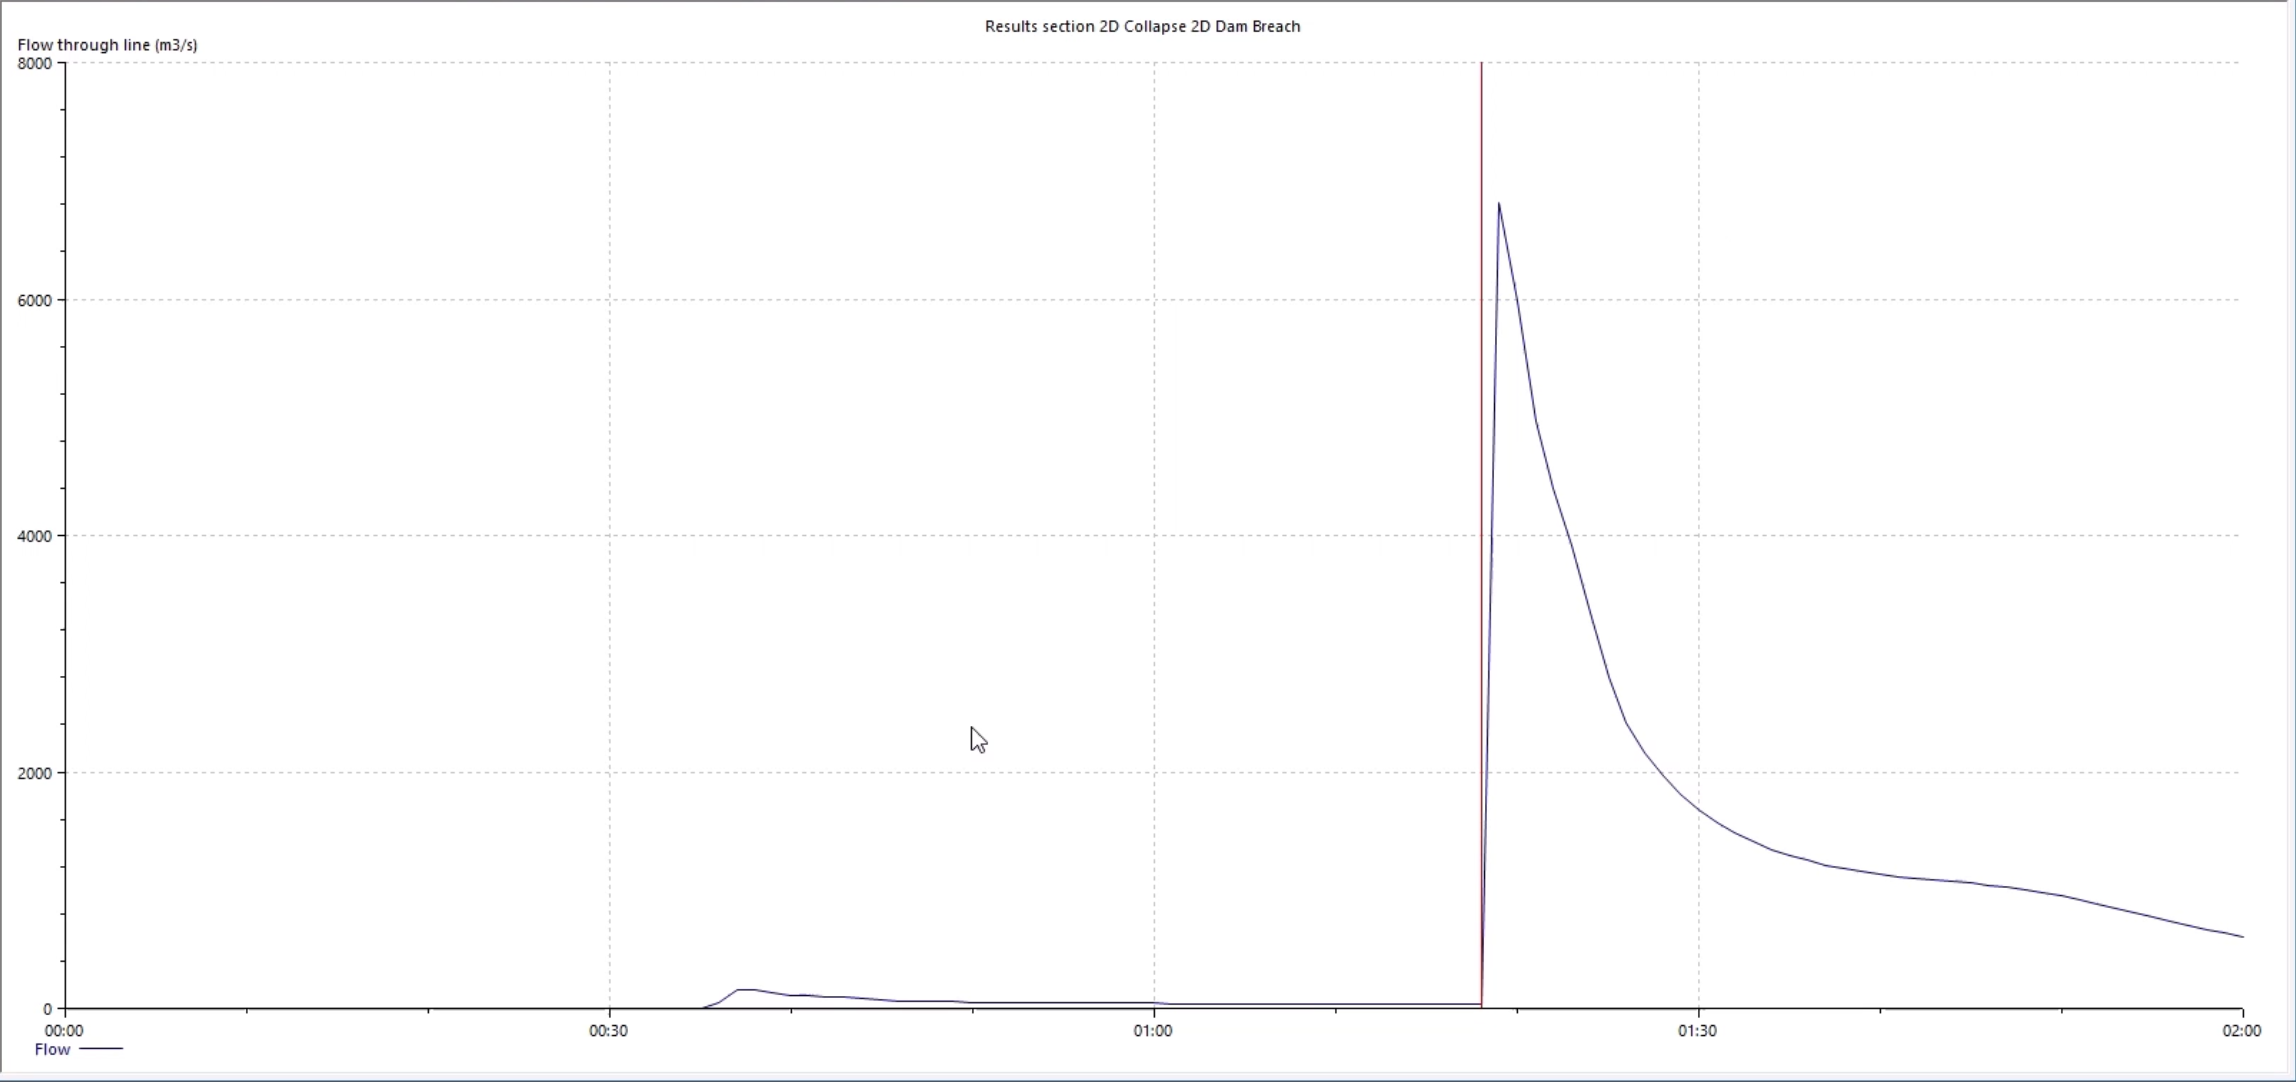
- In the Graph dialog box, select Flow through line (m3/s).
The resulting graph displays the flow through the drawn line as reaching over 7000 m3/s, meaning the water would do significant damage to anything in its path.
- Close the graph tab.
Once 2D results objects are created, they can be saved for future use, or added to a different set of results:
- In the Explorer window, click the Database tab.
- In the GeoPlan Tools toolbar, click the Selection tool and make sure the GeoPlan is selected.
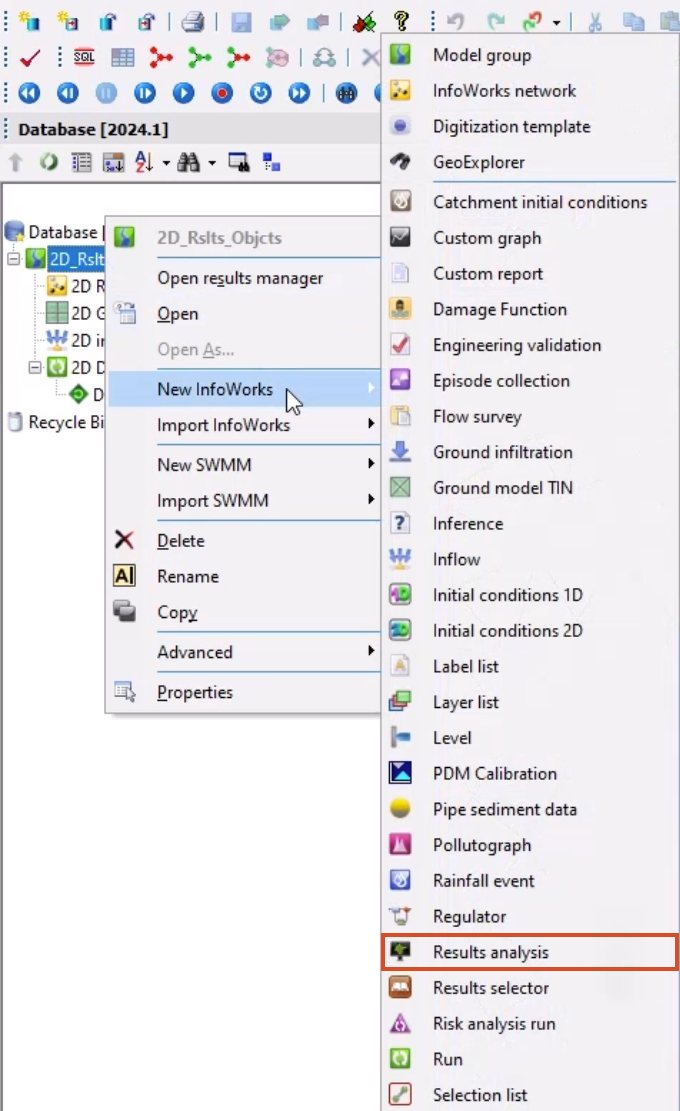
- Right-click the model group and select New InfoWorks > Results analysis.
- In the Results analysis dialog box, the results analysis can be renamed, but for this example, click OK.
In the Explorer window, the work is saved within the new Results analysis item, which can also be viewed as a graph or exported.