Understand seat usage reports for single-user subscriptions
Seat usage reporting has three different methods in which it displays information: Summary, By product, and By user. Using the different methods results in different sets of data, giving admins the ability to monitor which users are using their assigned products and their frequency of use. This enables admins to optimize seat assignments and strategize on future purchasing decisions.
Prerequisites
To view product seat usage and utilization, you only need to assign the software to a user. When a user launches a product, usage starts and is recorded. It stops when they close the product. Usage is reported by the number of days a product is used. By default, users’ names and email addresses are hidden for privacy reasons. To display users’ names and email addresses, you need to turn this feature on.
- The data that is collected is only available for products with single-user access and can only measure the activity of users connected to the internet.
How to Display Users’ Names and Email Addresses
- Sign in to Autodesk Account at manage.autodesk.com.
- In the navigation panel>User Management section, select By User.
- The User Management by User page displays. Expand the Team drop-down menu and select the team you want to change the settings for.
- Click
 (Team settings) in the upper-right corner.
![]()
- The settings for the team displays. In the Reporting section, check the checkbox to include personal data in reporting and insights.

Getting to Know Seat Usage Reports
By default, when you select the Seat Usage option under the Reporting section, the Summary report displays. It is helpful to understand the different options that are available to you when navigating through the reports.
- Report types: Select one of the three options to view the seat usage data report by summary, by product, or by user.
- Team: This expandable menu lets you change the team to display seat usage by all teams or by an individual team.
- Time range: This expandable menu lets you change the displayed data by a specific time range.
- Report: This area displays the seat usage data for single-user software based on the specified time range.
- View details: Clicking this option will display seat usage by each product within the collection.

How to View the Seat Usage Summary
- Sign in to Autodesk Account at manage.autodesk.com.
- In the navigation panel>Reporting section, select Seat Usage.
- The Seat Usage page displays. By default, the Summary report type is selected. For all products, the seat usage summary tracks the following:
- Total users: When an assigned product is opened and used by someone on your team, they are counted in this list within the selected length of time.
- Products in use: This is the number of assigned products that users have used within the selected length of time.
- Total seats: This shows the current total number of seats you have subscribed to for products with single-user access. “Current” is based on the Data last processed on <Date> at the bottom of the summary.
- Expand the Team drop-down menu and select an individual team or All teams to display the appropriate data report.
- Expand the time range drop-down menu and select one of the options: This month, Last 3 months, Last 6 months, Last 9 months, or Last 12 months.

- For more details on a specific product in the report, click View details next to the product name to view usage by individual products.
- Click the arrow to the left of the software name to go back to the summary page.

How to View Seat Usage By Product
For individual products, reports track the number of assigned users, seats available, frequency of use, and use by version.
- Sign in to Autodesk Account at autodesk.com.
- In the navigation panel>Reporting section, select Seat Usage.
- On the Seat Usage page, expand the Team drop-down menu and select the team name that you would like to view reports for.
- Select the By product Each of the software products or collections displays within a card.

- Expand the time range drop-down menu and select one of the options: This month, Last 3 months, Last 6 months, Last 9 months, or Last 12 months.
- Within a card, click the View details button to view usage data for the selected product or all products within the selected collection.

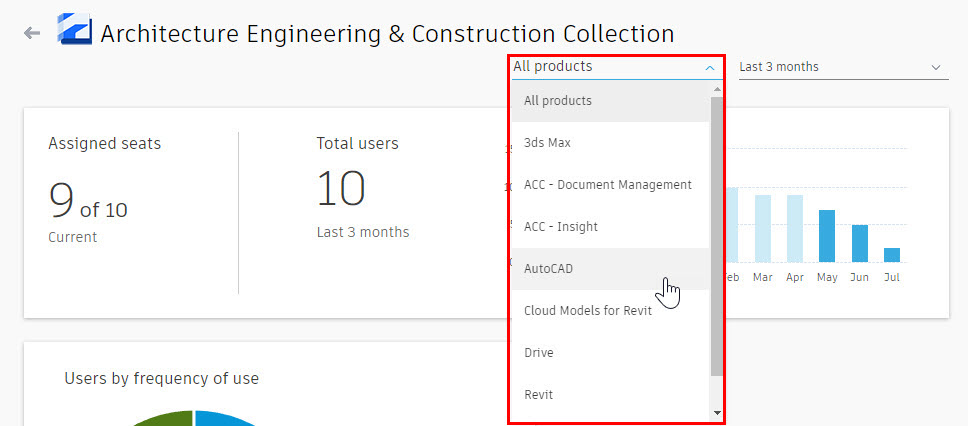
- To view a detailed report for a specific software within the collection, expand the All products drop-down menu and select an individual product. The report will show usage information and the Users by version
- Expand the time range drop-down menu and select one of the options: This month, Last 3 months, Last 6 months, Last 9 months, or Last 12 months.

- To navigate back one page, click the gray arrow in the upper-left corner. To navigate back to the main Seat Usage page, click Seat Usage in the navigation panel.
How to View Seat Usage By User
These reports track how often products are used by individual users.
- Sign in to Autodesk Account at manage.autodesk.com.
- In the navigation panel>Reporting section, select Seat Usage.
- On the Seat Usage page, expand the Team drop-down menu and select the team name that you would like to view reports for.
- Select the By user A summary of your active and inactive users, how often products are used, and the last time an assigned product was used will display.

- Expand the time range drop-down menu and select one of the options: This month, Last 3 months, Last 6 months, Last 9 months, or Last 12 months.
- To display details about product usage for an individual user, click on the user’s name.

- The Products used tab for the user displays. Click View details next to the product’s name to view what products the user is using and not using, and the number of days used.
- To get back to the user’s product list, click the arrow next to the product name.

- Click the Days used tab to view a graph of product usage over time. You can hover your cursor along the graph to display more information.

- Scroll down to view the Products used section to view the usage over time per product.
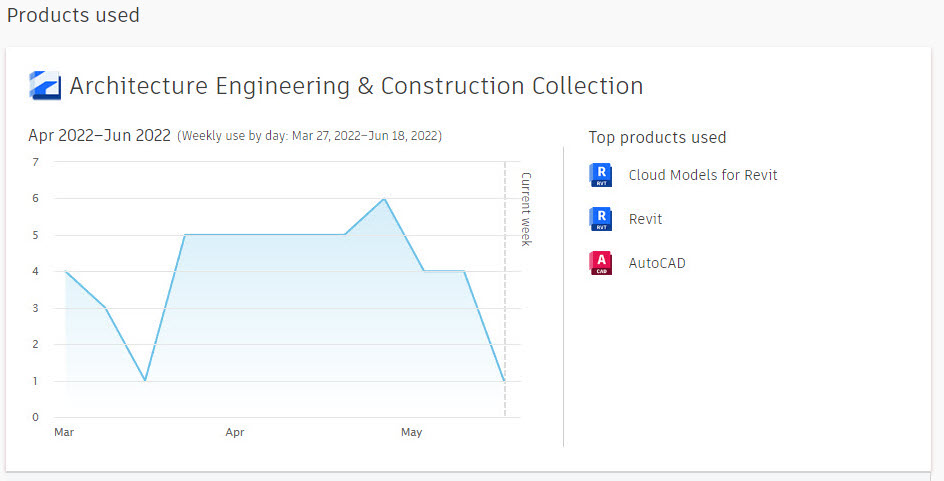
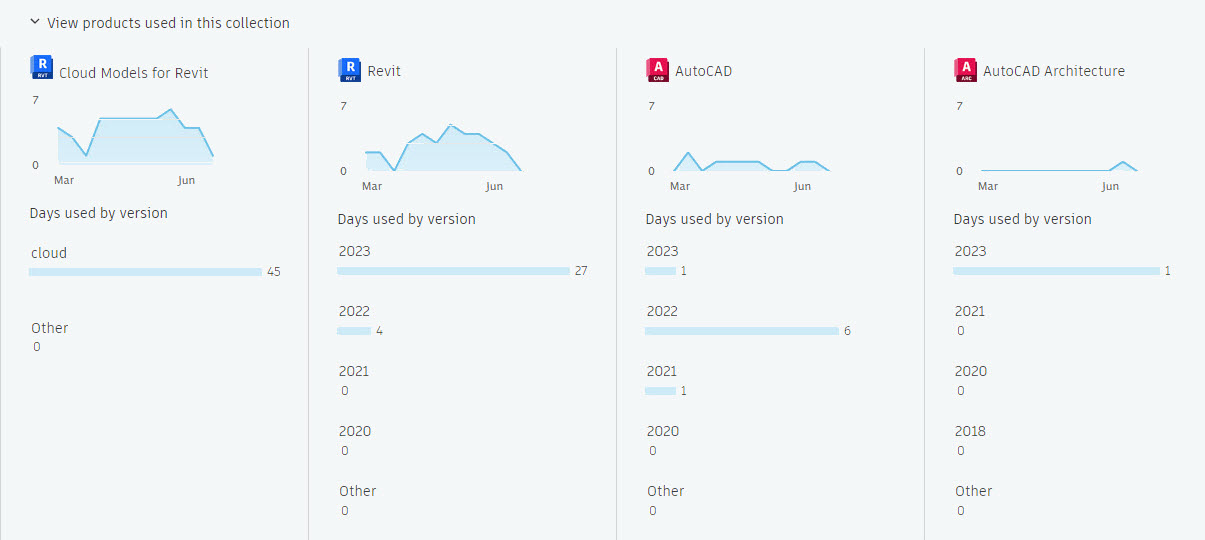
- When viewing data for a collection, you can scroll down and expand View products used in this collection to view more detailed information about the products used.
- Scroll back to the top of the page and click on the Unused products If the user has been assigned a product but has not used it, the product will display here.
- To review another user’s product information, scroll to the top of the page and click the gray arrow to get back to the list of users.

Exporting Data
Autodesk allows you to export seat usage report data so that you may review it in another analysis tool of your choice. Note: You can also export from your List of users (User Management > By User or By Product) or Subscriptions (Billing and Orders > Subscriptions and Contracts).
How to Export Data
- Sign in to Autodesk Account at manage.autodesk.com.
- In the navigation panel>Reporting section, select Seat Usage.
- On the Seat Usage page, expand the Team drop-down menu and select the team that you would like to export a report for.
- Click Export to display the Export page.

- On the Export page, verify the correct team is selected in the Team drop-down menu.
- Expand the Format drop-down menu and select either XLSX or CSV for the file type.
- In the Data section, select which Categories you want data to export for.
- Specify a Date Range for the data.
- Click Export.

- Your file will begin processing for download within the Export History section at the bottom of the page. If there are any existing exports, they will display in this section.
- Once the file has finished processing, click Download to download the file to your default downloads folder.
Getting to Know the Usage Report
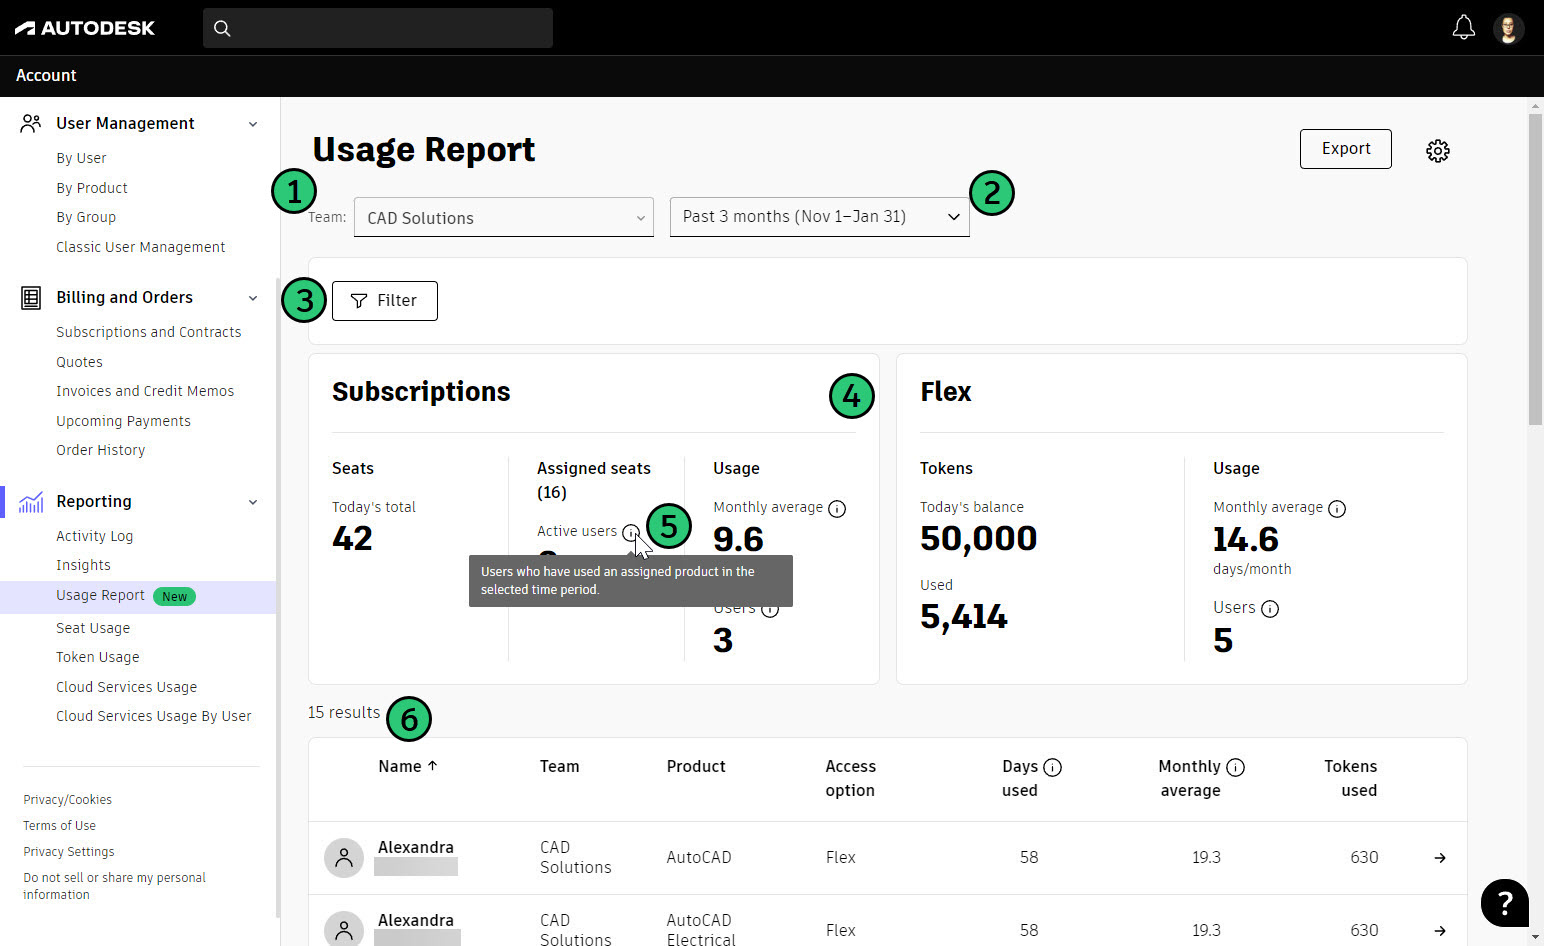
Usage reporting unifies both seat and Flex usage reports. Filters allow you to select products and timeframes for the report. With this information, admins can optimize seat assignments and purchasing decisions for collections, individual products, and Flex for occasional use. Usage reporting is only available for products with single-user access and can only measure the activity of users connected to the internet.
- Team: This expandable menu lets you change the team to display usage by all teams or by an individual team.
- Time range: This expandable menu lets you change the displayed data by a specific time range.
- Filter: This expandable menu lets you narrow down what data you would like to review: Access options, User activity (subscription only), Seat assignments, and/or Products.
- Report: This area displays the seat usage data for single-user software based on the specified time range.
- Information Icon: Hover your cursor over the information icon to understand what each of the reporting data is about.
- Results: This section shows each user within the selected team and the filtered parameters at a glance, providing information regarding Team, Product, Access option, Days used, Monthly average, and Tokens used. NOTE: If your team's personal data (PII) is On in settings, user names are displayed. If personal data is Off for one or more teams, hashed data values are shown for all teams.
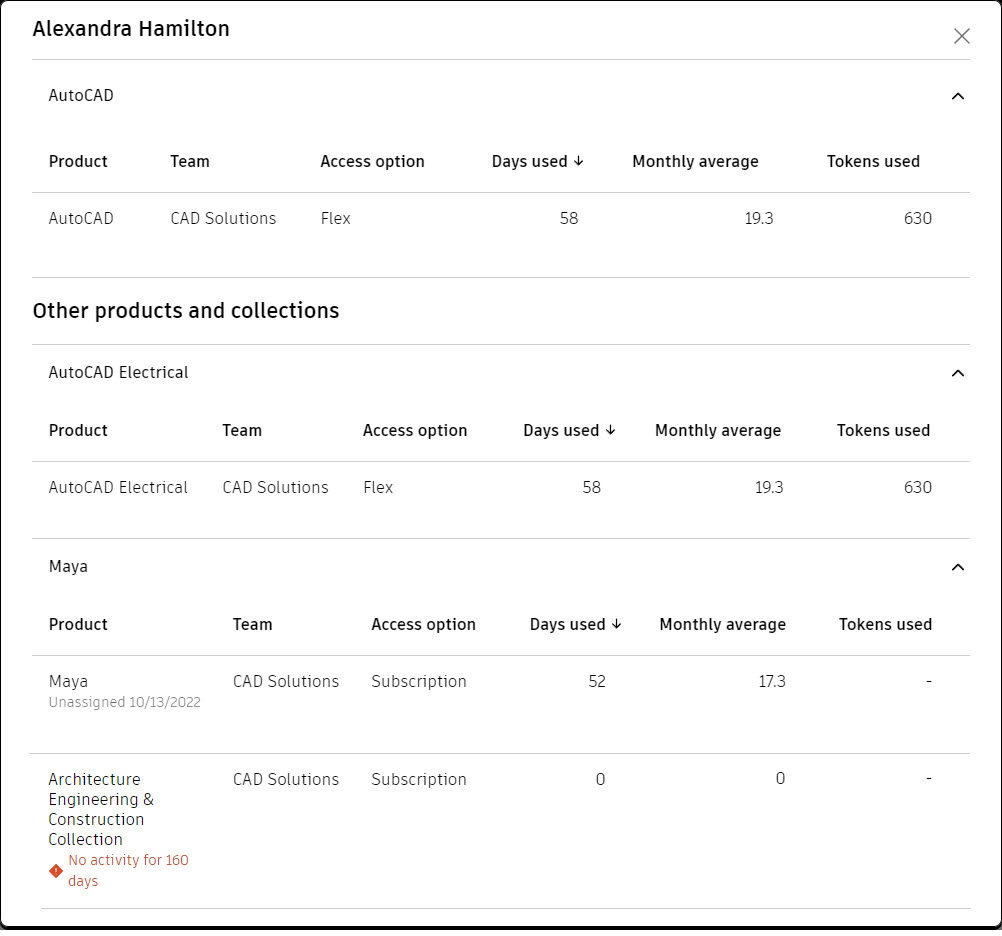
- If a user has been unassigned from a product, information on when the product was unassigned from the user will display.
- If there is a product that a user is not using, there will be a No activity notification below the product’s name noting how many days the user has not used the product or products within a collection.
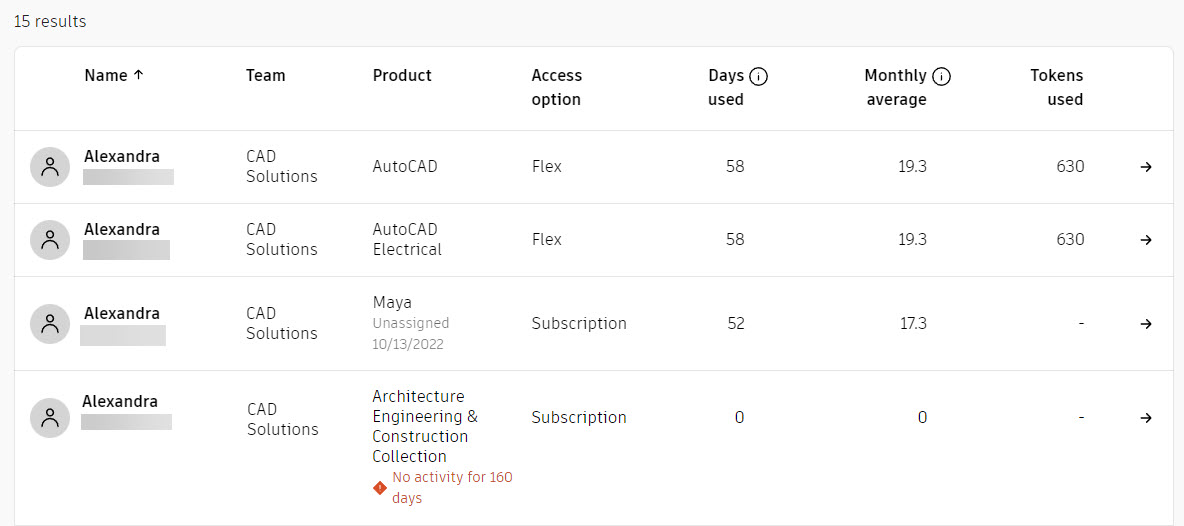
- Select on a user within the results list to see all product details for subscription and Flex, if applicable.
Additional Resources
- For more information on usage reporting, you can view the following Knowledge Network articles:
- For updated information on Insights, reference the Knowledge Network.
- If you have any issues or questions about reporting, you can click the
 icon in the lower-right corner to access the Get Help menu. Select Post-purchase support > User & license management > Reporting. You can review the Knowledge Network articles or click Contact a support agent for further help.
