Simulating drain down and recharge
Any referenced datasets can be downloaded from "Module downloads" in the module overview.
Video quiz
Step-by-step Guide
In InfoWorks WS Pro, drain down and recharge simulation options can improve the model accuracy for a situation in which a network loses pressure and is later recharged. A simulation can highlight the first and last customers to lose pressure and how long it may take to regain it. In this exercise, part of a small network is isolated for a water quality issue.
- From the Model Group window, under Draindown, drag-and-drop the DrainTown network into the workspace to open the GeoPlan.
This network is supplied by a fixed head node, a pumping station to the East. To simulate drain down, close an isolation valve just downstream of the pumping station.
Start by creating a new scenario:
- In the Scenarios toolbar, click the Create Scenario button:
- In the New Scenario Name field, enter “Isolation”.
- Click OK.

Next, select a valve to close:
- In the GeoPlan, zoom into the area of the network immediately downstream of the pumping station.
- Double-click the valve with asset ID 205301.
In the Valve Object Properties panel, under Valve Control, notice the Mode ID is currently set to THV (a throttled valve), which does not change during a simulation. Change it to a time-controlled valve (TCV), which can open and close to model a temporary shutdown.
- Expand the Mode ID drop-down and select TCV.

To set the valve to be fully open at midnight, to close at 6 am, and to open again at 7 pm:
- In the Profiles field, click the More (…) button.
- In the profile graph window, in the Date & Time column, expand the drop-down and select March 1, 2023.
- Leave the time of day set to 00:00:00.
- In the Opening (%) column, enter “100”.
- In the second row, set the date to March 1, 2023.
- Set the time to 06:00:00.
- Set the Opening (%) to “0”.
- In the third row, set the date to March 1, 2023.
- Set the time to 19:00:00.
- Set the Opening (%) to “100”.
- Click OK.

- Commit the changes to the database.
Now, create a new run:
- In the Model Group window, right-click Draindown and select New > Run Group.
- In the Run Group dialog box, click OK.
- From the Model Group window, right-click the new Run Group and select New > Run.
- In the Schedule Hydraulic Run dialog box, in the Title field, enter the name “IsolationBase”.
- Enable the Experimental option.
- From the Model Group windows, drag the DrainTown network into the Schedule Hydraulic Run dialog box and drop it into the Network pane.

In this example, the Control and Demand Diagram panes populate automatically, because they were previously associated with the DrainTown network.
- Open the Scenarios tab.
- Disable the Base scenario.
- Enable Isolation.
- Click Save.
- Click Run.

InfoWorks WS Pro does not simulate drain down by default, so the results of this run serve as a “before” snapshot for comparison later.
To graph the results:
- Once the run finishes, drag-and-drop the results into the workspace to open the GeoPlan.
- In the Tools toolbar, click the Graph button.
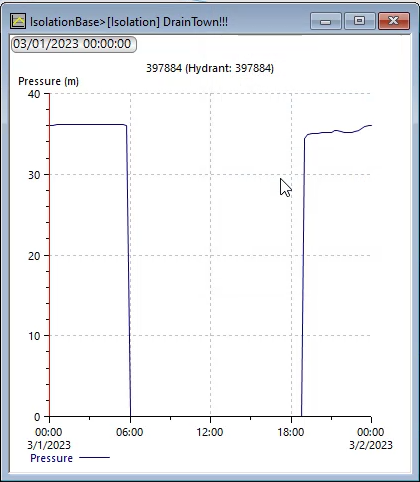
- Click a hydrant downstream of the valve. In this example, the hydrant with asset ID 397884 is selected.
The graph indicates a total loss in pressure at 6 am when the valve closes, and a return to normal pressure at 7 pm after the valve opens again.
- Optional: Graph any link to view similar effects on flow.
To identify which customers were isolated during this operation:
- In the Model Group window, expand the Stored Query group.
- Drag-and-drop the Select Isolated Customers query into the GeoPlan to run it.

All network customers isolated longer than an hour appear highlighted in red. In this case, every customer downstream of the valve is affected.
To identify the number of isolated customers:
- From the Model Group window, under Stored Query, drag-and-drop the Isolated Customer Count query into the GeoPlan.
A small grid appears, indicating that 230 customers were isolated.
- In the Operations toolbar, click Clear selection.
Next, run another simulation, but this time, with drain down enabled:
- In the Model Group window, double-click the IsolationBase run.
- In the Schedule Hydraulic Run dialog box, change the name to “IsolationDraindown”.
- Click Save.
The new run displays in the Model Group window.
- In the Schedule Hydraulic Run dialog box, in the lower-left corner, expand the drop-down and select Simulation Options.
- Click the Options button.
- In the Simulation Options window, enable Allow Drain Down.
- Enable Allow Recharge.

- Close the window.
- In the Schedule Hydraulic Run dialog box, click Save.
- Click Run.
To graph the results of the drain down run:
- From the Model Group window, drag-and-drop the results into the GeoPlan.
- In the Tools menu, click Graph.
- In the GeoPlan, select the same hydrant as in the base run, with asset ID 397884.

The graph shows that instead of the pressure dropping to zero, it stops at a lower value and then gradually decreases until around 6 pm.
- Graph any link downstream from the valve.

Notice the flow is impacted during the isolation period but is not immediately interrupted, as in the base run.
- Run the Select Isolated Customers query again.
- Run the Isolated Customer Count query.

The Select Isolated Customers query shows far fewer customers isolated for longer than an hour, as compared to the base run. Customers not highlighted retained lower water pressure, rather than losing it completely. The Isolated Customer Count query shows only 60 customers isolated, as compared to 230.
To visualize the run results using a long section:
- In the Tools toolbar, select the Trace and select links upstream button.
- In the GeoPlan, click to highlight the southwestern-most point in the network and run a trace back to the water source.

- In the Windows toolbar, click the New long section button to view the traced portion of the network as a long section.

- In the GeoPlan, right-click the long section window and select Properties.
- In the Section Properties dialog box, disable Show Min/Max HGL Lines, for better visual clarity when viewing the long section.
- Click OK.

In the long section window, the horizontal blue line indicates the pressure level in relation to the position within the long section.
- In the Replay toolbar, click Play to step through the simulation timeline.

Notice the pressure changes at 6 am when the valve is closed, and then gradually decreases until 7 pm. Portions of the network immediately downstream of the isolation lose pressure during this time, but areas further downstream maintain pressure. At 7 pm, the isolation valve reopens, and the network is recharged.