& Construction

Integrated BIM tools, including Revit, AutoCAD, and Civil 3D
& Manufacturing

Professional CAD/CAM tools built on Inventor and AutoCAD
Integrated BIM tools, including Revit, AutoCAD, and Civil 3D
Professional CAD/CAM tools built on Inventor and AutoCAD
Any referenced datasets can be downloaded from "Module downloads" in the module overview.
Transcript
00:04
After a steady state simulation has been run successfully,
00:07
you can use the report manager to view different
00:10
reports from your simulation in both tabular and graph formats
00:15
to begin
00:16
double click the desired project dot APR X file to open Argi
00:20
Pro.
00:22
Once the project starts,
00:24
click the info Water pro tab to open the info Water Pro ribbon
00:29
in the project panel, click initialize
00:33
on the info water pro ribbon
00:35
in the view panel, click report manager
00:39
in the report manager dialog box, click new
00:44
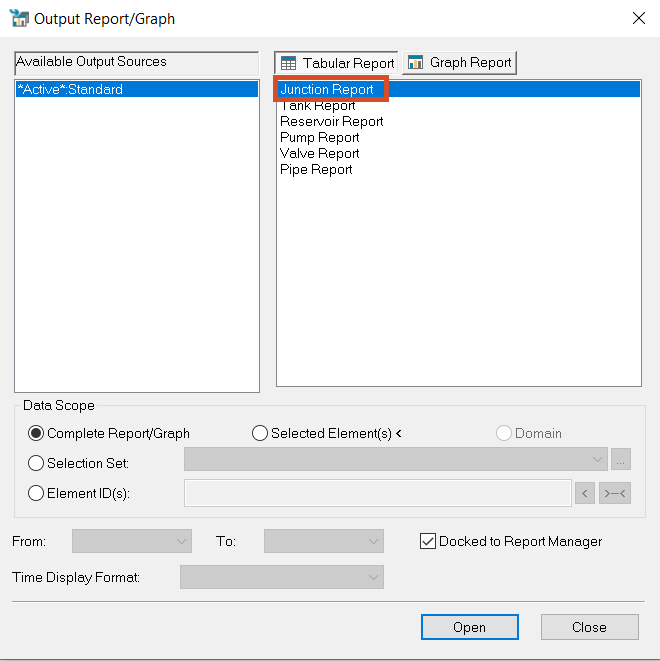
in the output report slash graph dialog box select junction report
00:50
and then click open
00:52
a table appears which contains one record for each junction node.
00:56
In the current info Water Pro project,
00:60
you can sort the results to find the information you are looking for.
01:03
Click the pressure heading to select the column.
01:07
Then from the toolbar,
01:08
click the sort ascending and sort descending buttons to sort the column.
01:14
You can see that the highest pressure in the system is 169.94 psi
01:20
and the lowest pressure is 1.75 psi
01:25
you can also access specific data when you right. Click a column heading.
01:31
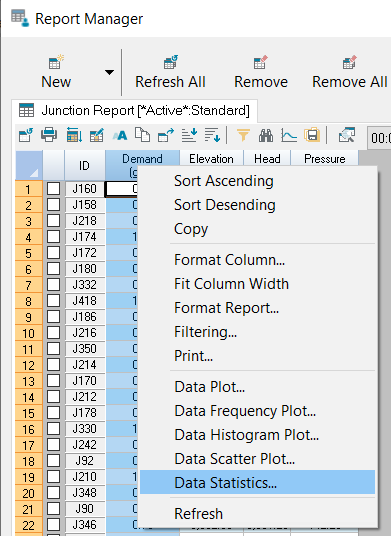
Click the demand heading to select the column
01:35
right, click the heading and select data statistics.
01:39
These numbers show you information such as the highest demand,
01:43
maximum value and the total demand in the system.
01:48
Click OK.
01:51
You can also view reports or graphs based on a selection of your model
01:56
on the info water pro ribbon
01:58
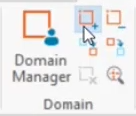
in the domain panel, click enlarge domain,
02:03
select an area of the system of between 50 and 100 pipes
02:11
in the view panel. Click report manager.
02:15
You may need to move the report manager to the side.
02:19
You can see your selection highlighted in the model
02:22
in the report manager. Click new
02:26
in the output report slash graph dialog box,
02:28
select pipe report and in data scope select domain
02:33
to limit the report or graph to the active domain.
02:36
Click open
02:40
the report manager populates with a new table
02:42
that contains only the data for the pipes.
02:45
You just selected,
02:47
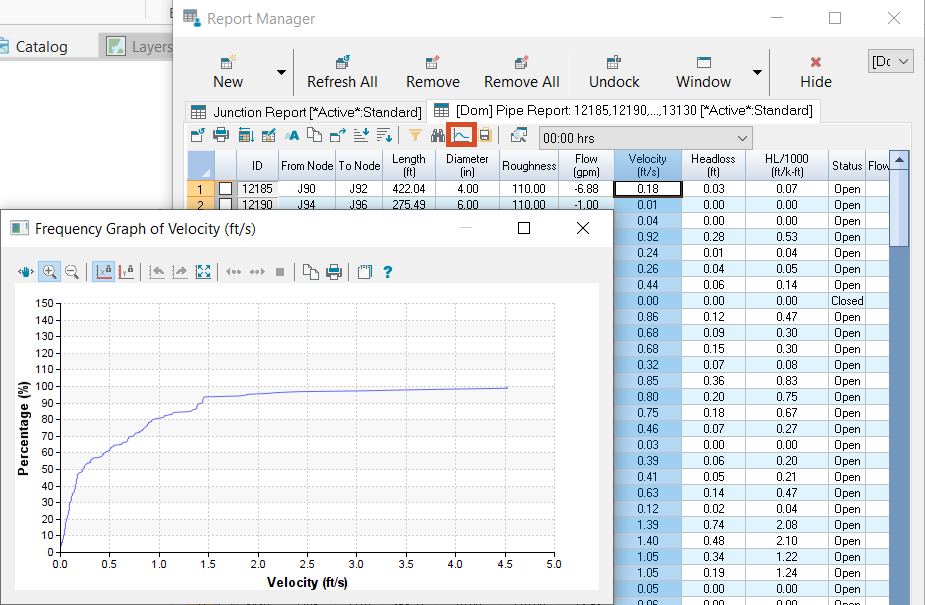
select the velocity column heading and then from the toolbar.
02:51
Click frequency graph,
02:54
a graph appears containing the velocity data for your selected pipes.
02:59
When you are finished reviewing the data, close the graph and the report manager
03:04
on the info water pro ribbon in the domain panel,
03:07
click clear domain to undo your pipe selection.
Video transcript
00:04
After a steady state simulation has been run successfully,
00:07
you can use the report manager to view different
00:10
reports from your simulation in both tabular and graph formats
00:15
to begin
00:16
double click the desired project dot APR X file to open Argi
00:20
Pro.
00:22
Once the project starts,
00:24
click the info Water pro tab to open the info Water Pro ribbon
00:29
in the project panel, click initialize
00:33
on the info water pro ribbon
00:35
in the view panel, click report manager
00:39
in the report manager dialog box, click new
00:44
in the output report slash graph dialog box select junction report
00:50
and then click open
00:52
a table appears which contains one record for each junction node.
00:56
In the current info Water Pro project,
00:60
you can sort the results to find the information you are looking for.
01:03
Click the pressure heading to select the column.
01:07
Then from the toolbar,
01:08
click the sort ascending and sort descending buttons to sort the column.
01:14
You can see that the highest pressure in the system is 169.94 psi
01:20
and the lowest pressure is 1.75 psi
01:25
you can also access specific data when you right. Click a column heading.
01:31
Click the demand heading to select the column
01:35
right, click the heading and select data statistics.
01:39
These numbers show you information such as the highest demand,
01:43
maximum value and the total demand in the system.
01:48
Click OK.
01:51
You can also view reports or graphs based on a selection of your model
01:56
on the info water pro ribbon
01:58
in the domain panel, click enlarge domain,
02:03
select an area of the system of between 50 and 100 pipes
02:11
in the view panel. Click report manager.
02:15
You may need to move the report manager to the side.
02:19
You can see your selection highlighted in the model
02:22
in the report manager. Click new
02:26
in the output report slash graph dialog box,
02:28
select pipe report and in data scope select domain
02:33
to limit the report or graph to the active domain.
02:36
Click open
02:40
the report manager populates with a new table
02:42
that contains only the data for the pipes.
02:45
You just selected,
02:47
select the velocity column heading and then from the toolbar.
02:51
Click frequency graph,
02:54
a graph appears containing the velocity data for your selected pipes.
02:59
When you are finished reviewing the data, close the graph and the report manager
03:04
on the info water pro ribbon in the domain panel,
03:07
click clear domain to undo your pipe selection.
After a steady state simulation has been run successfully, you can use the Report Manager to view different reports from your simulation in both tabular and graph formats.
A table appears that contains one record for each junction node in the current InfoWater Pro project. To sort the results:
To access the data submenus:
These numbers show you information such as the highest demand (Maximum Value) and the total demand in the system.
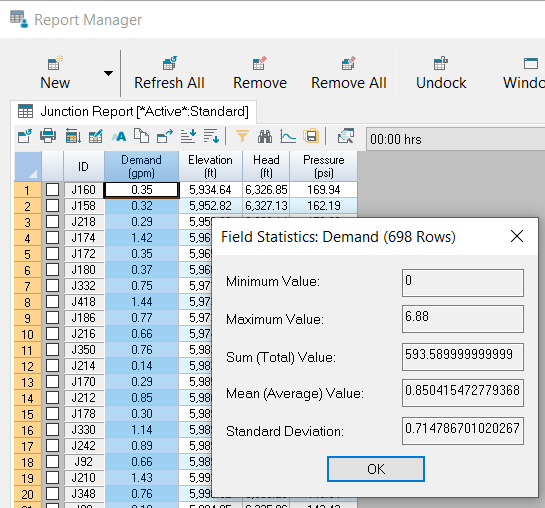
To view reports or graphs based on a selection within the model:
The Report Manager populates with a table that contains only the data for the pipes you just selected. To see their velocity data:
How to buy
Privacy | Do not sell or share my personal information | Cookie preferences | Report noncompliance | Terms of use | Legal | © 2025 Autodesk Inc. All rights reserved
Sign in to start learning
Sign in for unlimited free access to all learning content.Save your progress
Take assessments
Receive personalized recommendations
May we collect and use your data?
Learn more about the Third Party Services we use and our Privacy Statement.May we collect and use your data to tailor your experience?
Explore the benefits of a customized experience by managing your privacy settings for this site or visit our Privacy Statement to learn more about your options.