Performing a fire flow calibration
Any referenced datasets can be downloaded from "Module downloads" in the module overview.
Step-by-step guide
When using the Fire Flow Test calibration mode in InfoWater Pro, the desired pipe roughness range and Fire Flow measurement data can be specified. This example uses the Fire Flow Test mode to calibrate pipe roughness in a pressure zone.
- Double-click the desired project .aprx file to open ArcGIS Pro.
- Click the InfoWater Pro tab to open the InfoWater Pro ribbon.
- In the Project panel, click Initialize.
Start by running a simulation for the current scenario:
- On the InfoWater Pro ribbon, Analysis panel, click Run to open the Run Manager.
- Click Run to run the simulation and create an output for the current scenario.
- Click OK to close the Run Manager.
Set up a Fire Flow Test calibration run for the active scenario:
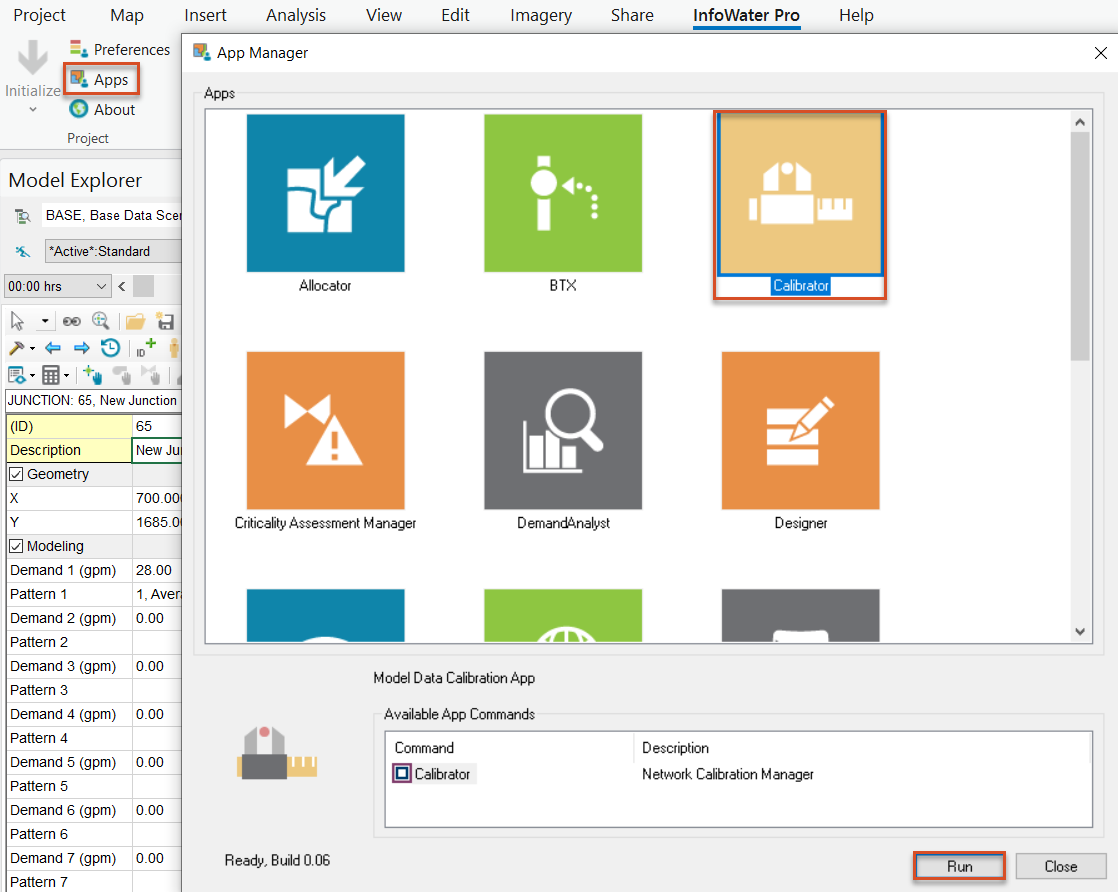
- On the InfoWater Pro ribbon, in the Project group, click Apps.
- From the Apps Manager, select Calibrator.
- Click Run to open the Calibrator app.
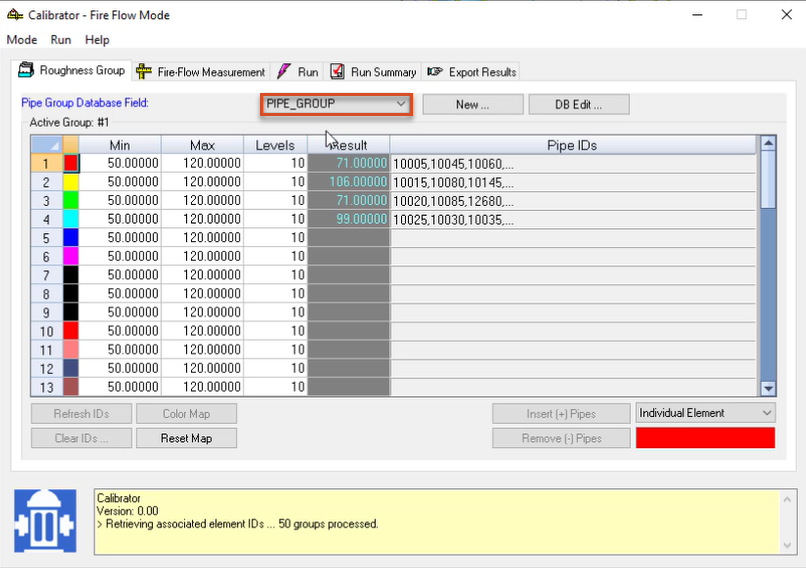
- From the Mode menu, select Fire Flow Test.
- From the Roughness Group tab, in the Pipe Group Database Field drop-down, select PIPE_GROUP.
The PIPE_GROUP is already created for this example and consists of four pipe groups of varying sizes in the model.
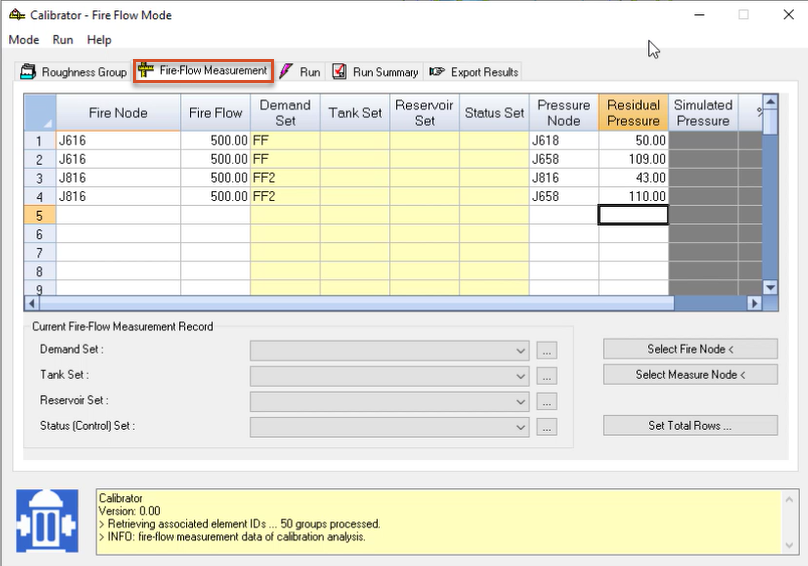
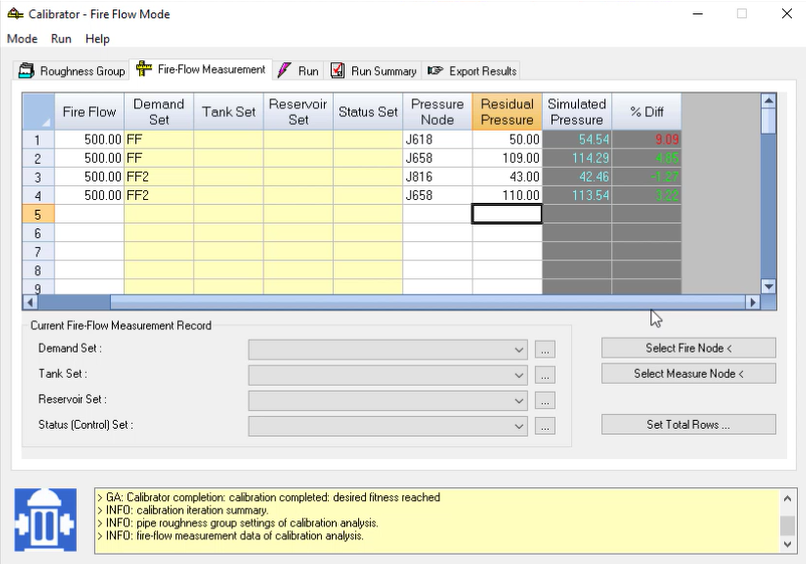
- Switch to the Fire-Flow Measurement tab.
Each row represents flow and pressure readings recorded during different hydrant-flow tests.
Set up the first four rows of the table:
- For row 1, enter a Fire Node of J616, a Fire Flow of 500, a Demand Set of FF, a Pressure Node of J618, and a Residual Pressure of 50.
- For row 2, enter Fire Node J616, Fire Flow 500, Demand Set FF, Pressure Node J658, and Residual Pressure 109.
- For row 3, enter Fire Node J816, Fire Flow 500, Demand Set FF2, Pressure Node J816, and Residual Pressure 43.
- For row 4, enter Fire Node J816, Fire Flow 500, Demand Set FF2, Pressure Node J658, and Residual Pressure 110.
Now, run the calibration simulation:
- From the Run menu, click Start to begin the calibration simulation process.
- On the Run tab, look for the green traffic light to indicate success.
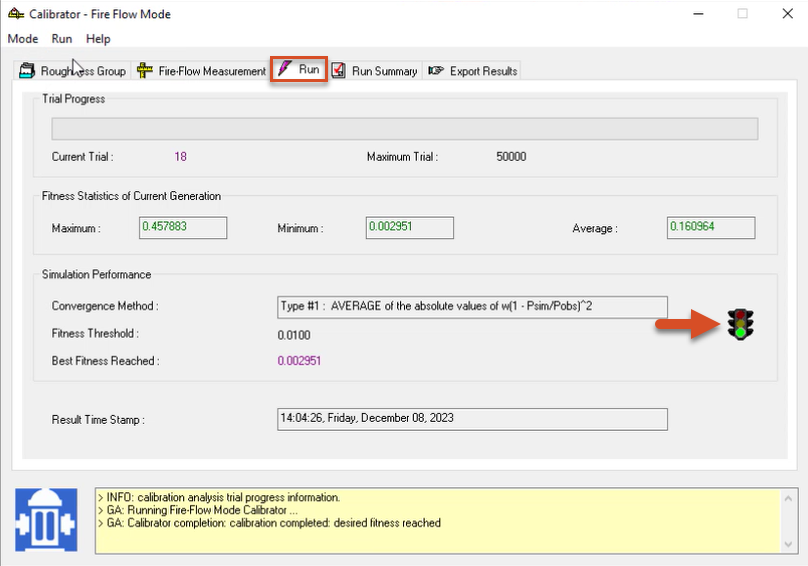
- Review the Run Summary tab as well.
Once complete, review the results on the tabs where data was previously entered:
- Select the Roughness Group tab to view the simulated roughness for the four pipe groups, based on observed junction pressure results.
- Select the Fire Flow Measurement tab to view the simulated pressure results at each specified junction, based on the new calibrated roughness, as well as the percent difference between observed pressure and simulated pressure.
Values in red in the % Diff column indicate values outside the evaluation thresholds set in the Calibration Options.
Once satisfied that the calculated roughness factors are reasonable, export the results to an existing or new pipe set:
- Switch to the Export Results tab.
- Click to enable Apply New Roughness Settings in.
- Click Browse (…) to open the Pipe Set dialog box.
- Click New.
- In the New Pipe Set dialog box, add a New ID of “NEW_PIPE_SET2.”
- Click OK.
- Click OK again to close the Pipe Set dialog box.
- Make sure that the new pipe set is selected in the drop-down.
- Click Export.
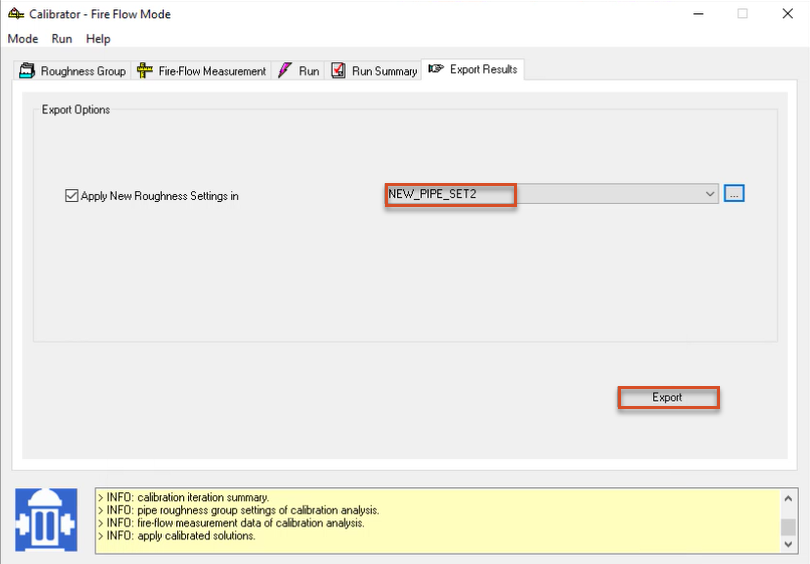
All roughness coefficients are applied to the various pipe groups.
- Close the Calibrator.
- Save the model.