& Construction

Integrated BIM tools, including Revit, AutoCAD, and Civil 3D
& Manufacturing

Professional CAD/CAM tools built on Inventor and AutoCAD
Integrated BIM tools, including Revit, AutoCAD, and Civil 3D
Professional CAD/CAM tools built on Inventor and AutoCAD
Any referenced datasets can be downloaded from "Module downloads" in the module overview.
Transcript
00:03
When you design a drainage system, you must often meet certain requirements.
00:07
That limit the discharge from the new design
00:09
into whichever receiving water course it discharges into
00:13
this could include rivers, streams or another pipe network.
00:18
A common design criteria is the so called no detriment theory,
00:22
which states that once a drainage system is developed,
00:25
the discharge from it
00:27
should not be any greater than what it was before it was built.
00:31
Info drainage can calculate what those pre development discharge levels are.
00:35
So you can make a post development comparison.
00:39
The easiest way to visualize this is with the simple diagram seen here,
00:43
which shows the different stages of water flow.
00:46
Starting with a pipe network.
00:49
This is followed by a storage or attenuation area and finally
00:53
the discharge control point before the water reaches the receiving watercourse.
00:58
Simply put there will be a regulatory entity
01:01
downstream from your development that controls the receiving watercourse
01:05
and dictates the amount of water you are allowed to discharge into it.
01:10
In this example with a pre existing info drainage model.
01:13
Start by determining the intended development area
01:17
on the ribbon
01:18
results tab reports panel click inflow summary.
01:23
The inflow summary dialog lists the area
01:26
of each sub catchment measured in hectares.
01:29
In the model
01:30
with the total area listed in the bottom row,
01:33
Remember this total
01:40
Close the dialog
01:42
now in the preliminary sizing tab calculators panel
01:46
select UK and Ireland rural runoff.
01:51
This opens a calculator that allows you to set different parameters to
01:54
measure the amount of runoff that occurs in this model before development.
01:59
In this example, the method is set to ice
02:02
suds, which is commonly used in UK runoff studies.
02:06
Set the area to 4.2.
02:09
The total area previously listed in the Inflow Summary Dialogue.
02:14
Next
02:14
designate the area where the development is.
02:17
You would normally select map and pick a point
02:20
on it which would populate all the fields.
02:22
But in this case, you want to type in the values to ensure consistent results
02:28
sets our 2 623 soil to 0.45 and use the drop down to set region six.
02:36
In the additional options group,
02:38
you can specify a percentage for how much of the area being developed is in
02:42
an urban environment but for this example assume that the area is entirely rural.
02:48
Set the return period years field to 30
02:51
and then click calculate
02:54
this populates the results table with rural runoff
02:56
estimates for a variety of return periods.
03:00
It is worth noting that the most common value used
03:03
in runoff studies is the cube are urban value,
03:06
which represents the discharge rate you are allowed in your drainage system.
03:11
This provides good design criteria to prevent detrimental effects downstream.
03:16
So in this example, the discharge from the site would be limited to 16.1 L per second
Video transcript
00:03
When you design a drainage system, you must often meet certain requirements.
00:07
That limit the discharge from the new design
00:09
into whichever receiving water course it discharges into
00:13
this could include rivers, streams or another pipe network.
00:18
A common design criteria is the so called no detriment theory,
00:22
which states that once a drainage system is developed,
00:25
the discharge from it
00:27
should not be any greater than what it was before it was built.
00:31
Info drainage can calculate what those pre development discharge levels are.
00:35
So you can make a post development comparison.
00:39
The easiest way to visualize this is with the simple diagram seen here,
00:43
which shows the different stages of water flow.
00:46
Starting with a pipe network.
00:49
This is followed by a storage or attenuation area and finally
00:53
the discharge control point before the water reaches the receiving watercourse.
00:58
Simply put there will be a regulatory entity
01:01
downstream from your development that controls the receiving watercourse
01:05
and dictates the amount of water you are allowed to discharge into it.
01:10
In this example with a pre existing info drainage model.
01:13
Start by determining the intended development area
01:17
on the ribbon
01:18
results tab reports panel click inflow summary.
01:23
The inflow summary dialog lists the area
01:26
of each sub catchment measured in hectares.
01:29
In the model
01:30
with the total area listed in the bottom row,
01:33
Remember this total
01:40
Close the dialog
01:42
now in the preliminary sizing tab calculators panel
01:46
select UK and Ireland rural runoff.
01:51
This opens a calculator that allows you to set different parameters to
01:54
measure the amount of runoff that occurs in this model before development.
01:59
In this example, the method is set to ice
02:02
suds, which is commonly used in UK runoff studies.
02:06
Set the area to 4.2.
02:09
The total area previously listed in the Inflow Summary Dialogue.
02:14
Next
02:14
designate the area where the development is.
02:17
You would normally select map and pick a point
02:20
on it which would populate all the fields.
02:22
But in this case, you want to type in the values to ensure consistent results
02:28
sets our 2 623 soil to 0.45 and use the drop down to set region six.
02:36
In the additional options group,
02:38
you can specify a percentage for how much of the area being developed is in
02:42
an urban environment but for this example assume that the area is entirely rural.
02:48
Set the return period years field to 30
02:51
and then click calculate
02:54
this populates the results table with rural runoff
02:56
estimates for a variety of return periods.
03:00
It is worth noting that the most common value used
03:03
in runoff studies is the cube are urban value,
03:06
which represents the discharge rate you are allowed in your drainage system.
03:11
This provides good design criteria to prevent detrimental effects downstream.
03:16
So in this example, the discharge from the site would be limited to 16.1 L per second
When you design a drainage system, you must often meet certain requirements that limit the discharge from the new design, into whichever receiving water course it discharges into. This could include rivers, streams, or another pipe network.
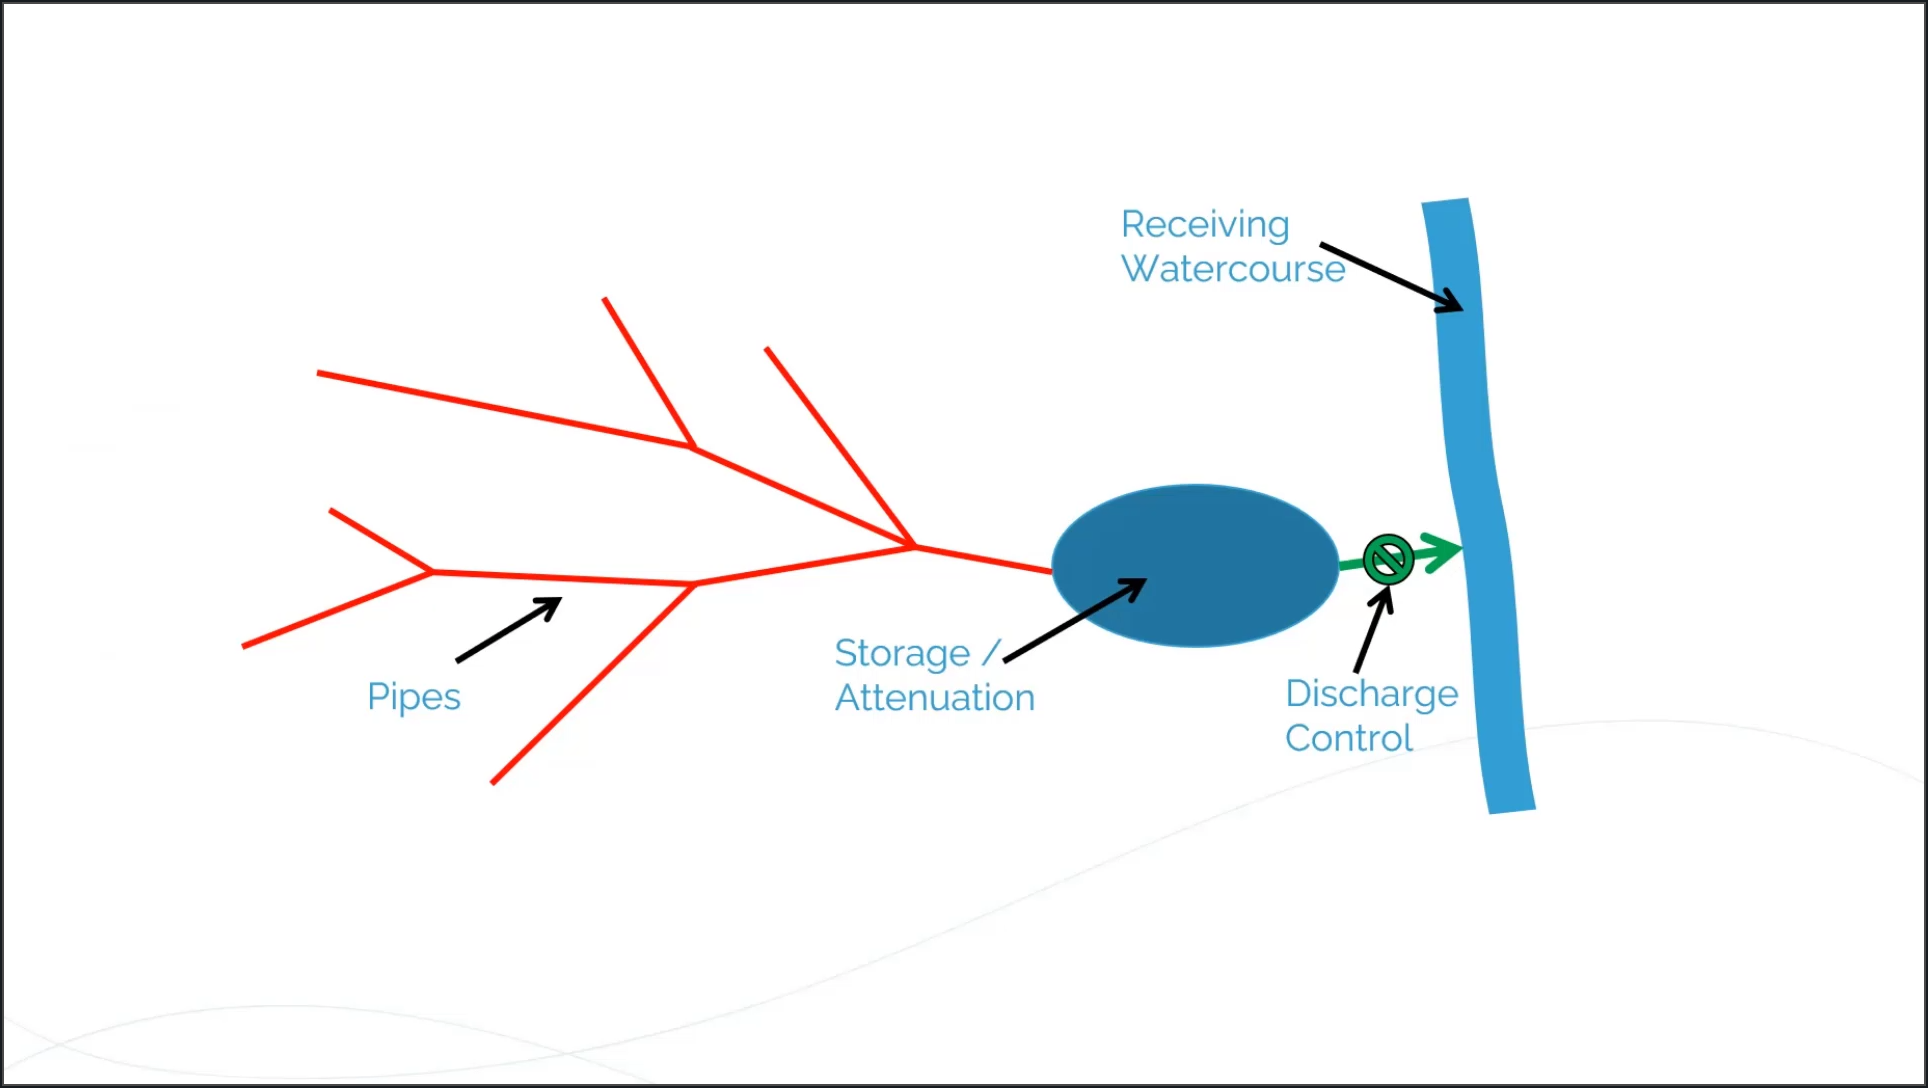
A common design criteria is the so-called “no detriment” theory, which states that once a drainage system is developed, the discharge from it should not be any greater than what it was before it was built. InfoDrainage can calculate what those pre-development discharge levels are so you can make a post-development comparison.
It is worth noting that the most common value used in runoff studies is the QBAR Urban value, which represents the discharge rate you are allowed in your drainage system. This provides good design criteria to prevent detrimental effects downstream, so in this example, the discharge from the site would be limited to 16.1 l/s.
How to buy
Privacy | Do not sell or share my personal information | Cookie preferences | Report noncompliance | Terms of use | Legal | © 2025 Autodesk Inc. All rights reserved
Sign in to start learning
Sign in for unlimited free access to all learning content.Save your progress
Take assessments
Receive personalized recommendations
May we collect and use your data?
Learn more about the Third Party Services we use and our Privacy Statement.May we collect and use your data to tailor your experience?
Explore the benefits of a customized experience by managing your privacy settings for this site or visit our Privacy Statement to learn more about your options.