About structured, non-structured, and photo data

00:00

LUCY KUHNS: Welcome to the managing point cloud

00:02

data in recap course.

00:04

The first objective in this course

00:06

is about structured, non structured,

00:09

and photo captured data.

00:11

This is an overview of the scan to BIM technology

00:14

that we will be showcasing.

00:17

We begin with the capture of the data from the LiDAR or photo

00:22

and then we process the data using recap

00:25

to register, index, crop, and export for use in our design

00:30

solutions, which include infraworks or civil 3D.

00:34

How can we use point cloud data in infrastructure projects?

00:38

We can use the point cloud only, we

00:40

can use it for visualization, measurement,

00:43

or as a design background.

00:45

We can also use it as a basis for feature extraction.

00:50

So we can pull geometry and surface topography

00:53

from the point cloud.

00:55

Or we can use a combination of both in this course,

00:59

we're going to focus on using point cloud data to generate

01:03

meaningful surface topography.

01:06

How is point cloud data created?

01:09

We can create it from LiDAR, which

01:11

is light detection and ranging.

01:13

We can create it from photogrammetry,

01:16

this is the extraction of

01:20

from images.

01:22

Or we can also get point cloud data from GIS repositories.

01:26

This is not a form of creation but it

01:28

is a valuable source where you can find huge amounts of point

01:32

cloud data.

01:33

The recap application has three import modes

01:37

and we're going to be talking about two of them.

01:40

The first is the import of LiDAR point cloud data

01:44

and this is the import from a file.

01:48

The recap import file types represent a wide variety

01:52

from the leading scanning equipment manufacturers

01:56

and also legacy and generic file types.

01:59

You can see these file types in the list

02:02

in the image on the right, it's important to understand

02:05

the recap output file types.

02:08

The RCS file type is the reality capture scan,

02:12

this is a proprietary format that contains the actual point

02:16

cloud data.

02:17

The file size is large because it holds the actual points.

02:21

If you Share Point clouds with others

02:24

you will need to share this file type.

02:27

The RCP file which is the reality capture project

02:31

file it is a much smaller file and it simply

02:35

references the point cloud data files

02:37

but it doesn't contain the actual data.

02:40

So remember, if you share this RCP file

02:43

you must also include the RCS files that

02:48

are referenced in the project.

02:50

If we take a look at the image below we

02:52

can see the huge file size difference

02:54

from the two different file types.

02:57

Now, let's talk about the point cloud data structure.

03:00

It's important to understand the two different structures

03:04

because the features and tools in recap

03:07

depend upon the structure type.

03:09

The two different types are structured and non structured.

03:13

Structured point cloud data comes from fixed origin

03:17

static scanners.

03:20

Here's an example of structured point cloud data in recap.

03:24

The first thing we note are the

03:29

when we click on them we go into the real view.

03:33

The real view is has we are seeing from the scanner

03:37

position.

03:38

The scanner position is also shown

03:40

in the bird's eye view or the aerial view

03:43

in the upper right hand corner.

03:46

When I click back into the 3D view

03:49

this is the actual point cloud data itself.

03:53

Non structured point cloud data is

03:55

scanned data that comes from aerial, mobile, and

03:58

photo-processed data.

04:01

Most infrastructure related data is of the non structured type.

04:06

Here is an example of what non structured scans look

04:10

like in recap.

04:11

The point cloud data came from drone captured imagery

04:15

that was processed from recap photo

04:18

and brought into recap as the point cloud.

04:22

When we zoom in, we can actually see

04:25

the triangular aerial targets that

04:28

were used as the ground control points to create

04:32

accurate and scale data.

04:34

Recap can also process photos to create point cloud data.

04:39

New technologies enable cameras instead

04:42

of expensive and heavy traditional LiDAR scanning

04:45

devices to be used.

04:47

Here's three examples, recap photo processes photo data,

04:53

the three file types that are returned from the processing

04:56

are a TIF file which represents the ortho image and RCS

05:01

file, which is the point cloud data

05:04

and an RCM file which is a photo textured mesh file.

05:10

The photo processing is done in the cloud

05:12

and uses cloud credits based on the number of photos

05:15

uploaded for processing.

05:17

There is a 1,000 photo limit.

05:20

The point cloud data from recap photo

05:23

is of the non structured data type.

05:26

Here is an overview of the process, you upload the photos,

05:30

you add the ground control points,

05:32

and then after processing you receive the RCS

05:37

the RCM and the ortho photo.

05:41

Let's get started with a simple exercise

05:43

to explore the recap basics, will open up an existing recap

05:49

project file.

05:52

Will open up the all drone capture

05:55

and with it opens or browse to the Project Settings

05:60

and will validate that the coordinate system is

06:02

in the Colorado central zone.

06:06

The units are meters and will go to the project navigator

06:11

and will expand the view state's collection

06:14

and the scan locations.

06:17

Will hover over the scan locations

06:19

to see how many millions of points there are in each scan.

06:24

Next, I'm going to click on the top view state

06:27

and we're going to go to the point display.

06:30

The default is in the RGB and I'm going to click on elevation

06:35

and we can see from the legend, the range of elevation

06:38

of our points.

06:40

I'm going to return to the RGB, which is the natural color

06:43

and we're going to look at a couple of the different view

06:46

states.

06:48

At the intersection view we're going

06:51

to look at changing the point cloud density to a one

06:57

pixel display and we're going to check

07:00

the dimensions to validate if the point

07:04

cloud is the right scale.

07:07

When I click on this we have to be

07:09

careful to look for the little red icon

07:13

to disappear which means that we're on top of a point.

07:18

Once I pick the two endpoints I can

07:20

validate that the width across the lanes is about 3.5 meters.

07:26

So we know that this data is in the right scale

07:30

for a metric project.

07:32

I'm going to do the same thing and measure

07:34

the distance of the height of the pedestrian bridge

07:38

above the pavement.

07:46

Seeing that it is about

07:51

So this is a quick introduction to some of the tools

07:54

that you're going to use in recap to validate and visualize

07:58

the data.

08:01

This is the completion of the first objective

08:04

and the next objective is using structure point cloud data.

Video transcript

00:00

LUCY KUHNS: Welcome to the managing point cloud

00:02

data in recap course.

00:04

The first objective in this course

00:06

is about structured, non structured,

00:09

and photo captured data.

00:11

This is an overview of the scan to BIM technology

00:14

that we will be showcasing.

00:17

We begin with the capture of the data from the LiDAR or photo

00:22

and then we process the data using recap

00:25

to register, index, crop, and export for use in our design

00:30

solutions, which include infraworks or civil 3D.

00:34

How can we use point cloud data in infrastructure projects?

00:38

We can use the point cloud only, we

00:40

can use it for visualization, measurement,

00:43

or as a design background.

00:45

We can also use it as a basis for feature extraction.

00:50

So we can pull geometry and surface topography

00:53

from the point cloud.

00:55

Or we can use a combination of both in this course,

00:59

we're going to focus on using point cloud data to generate

01:03

meaningful surface topography.

01:06

How is point cloud data created?

01:09

We can create it from LiDAR, which

01:11

is light detection and ranging.

01:13

We can create it from photogrammetry,

01:16

this is the extraction of

01:20

from images.

01:22

Or we can also get point cloud data from GIS repositories.

01:26

This is not a form of creation but it

01:28

is a valuable source where you can find huge amounts of point

01:32

cloud data.

01:33

The recap application has three import modes

01:37

and we're going to be talking about two of them.

01:40

The first is the import of LiDAR point cloud data

01:44

and this is the import from a file.

01:48

The recap import file types represent a wide variety

01:52

from the leading scanning equipment manufacturers

01:56

and also legacy and generic file types.

01:59

You can see these file types in the list

02:02

in the image on the right, it's important to understand

02:05

the recap output file types.

02:08

The RCS file type is the reality capture scan,

02:12

this is a proprietary format that contains the actual point

02:16

cloud data.

02:17

The file size is large because it holds the actual points.

02:21

If you Share Point clouds with others

02:24

you will need to share this file type.

02:27

The RCP file which is the reality capture project

02:31

file it is a much smaller file and it simply

02:35

references the point cloud data files

02:37

but it doesn't contain the actual data.

02:40

So remember, if you share this RCP file

02:43

you must also include the RCS files that

02:48

are referenced in the project.

02:50

If we take a look at the image below we

02:52

can see the huge file size difference

02:54

from the two different file types.

02:57

Now, let's talk about the point cloud data structure.

03:00

It's important to understand the two different structures

03:04

because the features and tools in recap

03:07

depend upon the structure type.

03:09

The two different types are structured and non structured.

03:13

Structured point cloud data comes from fixed origin

03:17

static scanners.

03:20

Here's an example of structured point cloud data in recap.

03:24

The first thing we note are the

03:29

when we click on them we go into the real view.

03:33

The real view is has we are seeing from the scanner

03:37

position.

03:38

The scanner position is also shown

03:40

in the bird's eye view or the aerial view

03:43

in the upper right hand corner.

03:46

When I click back into the 3D view

03:49

this is the actual point cloud data itself.

03:53

Non structured point cloud data is

03:55

scanned data that comes from aerial, mobile, and

03:58

photo-processed data.

04:01

Most infrastructure related data is of the non structured type.

04:06

Here is an example of what non structured scans look

04:10

like in recap.

04:11

The point cloud data came from drone captured imagery

04:15

that was processed from recap photo

04:18

and brought into recap as the point cloud.

04:22

When we zoom in, we can actually see

04:25

the triangular aerial targets that

04:28

were used as the ground control points to create

04:32

accurate and scale data.

04:34

Recap can also process photos to create point cloud data.

04:39

New technologies enable cameras instead

04:42

of expensive and heavy traditional LiDAR scanning

04:45

devices to be used.

04:47

Here's three examples, recap photo processes photo data,

04:53

the three file types that are returned from the processing

04:56

are a TIF file which represents the ortho image and RCS

05:01

file, which is the point cloud data

05:04

and an RCM file which is a photo textured mesh file.

05:10

The photo processing is done in the cloud

05:12

and uses cloud credits based on the number of photos

05:15

uploaded for processing.

05:17

There is a 1,000 photo limit.

05:20

The point cloud data from recap photo

05:23

is of the non structured data type.

05:26

Here is an overview of the process, you upload the photos,

05:30

you add the ground control points,

05:32

and then after processing you receive the RCS

05:37

the RCM and the ortho photo.

05:41

Let's get started with a simple exercise

05:43

to explore the recap basics, will open up an existing recap

05:49

project file.

05:52

Will open up the all drone capture

05:55

and with it opens or browse to the Project Settings

05:60

and will validate that the coordinate system is

06:02

in the Colorado central zone.

06:06

The units are meters and will go to the project navigator

06:11

and will expand the view state's collection

06:14

and the scan locations.

06:17

Will hover over the scan locations

06:19

to see how many millions of points there are in each scan.

06:24

Next, I'm going to click on the top view state

06:27

and we're going to go to the point display.

06:30

The default is in the RGB and I'm going to click on elevation

06:35

and we can see from the legend, the range of elevation

06:38

of our points.

06:40

I'm going to return to the RGB, which is the natural color

06:43

and we're going to look at a couple of the different view

06:46

states.

06:48

At the intersection view we're going

06:51

to look at changing the point cloud density to a one

06:57

pixel display and we're going to check

07:00

the dimensions to validate if the point

07:04

cloud is the right scale.

07:07

When I click on this we have to be

07:09

careful to look for the little red icon

07:13

to disappear which means that we're on top of a point.

07:18

Once I pick the two endpoints I can

07:20

validate that the width across the lanes is about 3.5 meters.

07:26

So we know that this data is in the right scale

07:30

for a metric project.

07:32

I'm going to do the same thing and measure

07:34

the distance of the height of the pedestrian bridge

07:38

above the pavement.

07:46

Seeing that it is about

07:51

So this is a quick introduction to some of the tools

07:54

that you're going to use in recap to validate and visualize

07:58

the data.

08:01

This is the completion of the first objective

08:04

and the next objective is using structure point cloud data.

About structured, non-structured, and photo data - Exercise

Task 1: Open an existing Recap project and check coordinate system setting

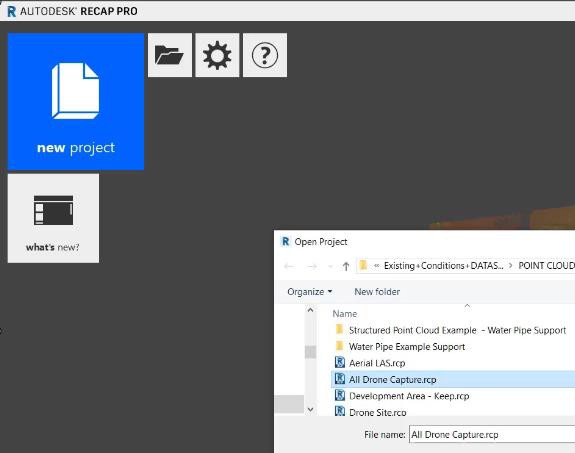
  1. Click on the Open Folder Icon in the upper left of the Recap interface.
  2. Browse to and open the project found in the dataset named All Drone Capture.rcp.


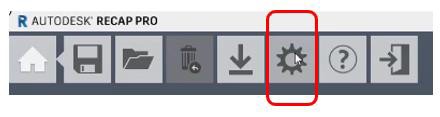
  3. Select on the gear symbol to launch the settings dialog.


  4. Verify that the Coordinate System is set to CO83-C and the project units are meters.


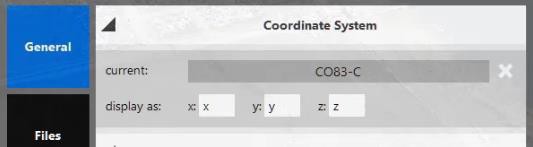
  5. Click OK to dismiss the Settings dialog box.

Task 2: Use Project Navigation panel

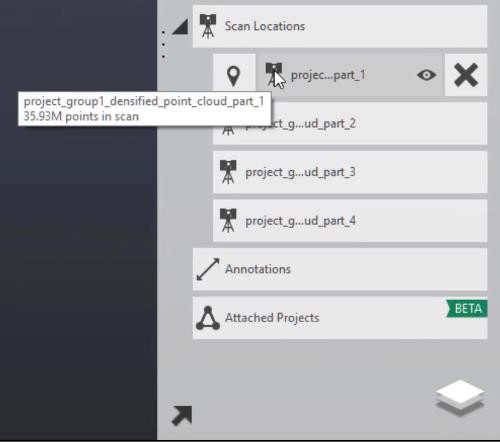
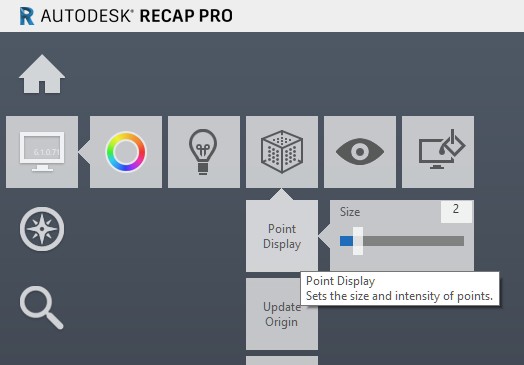
  1. Click on the tile stack in the lower right corner of the interface to open the Project Navigation panel.
  2. Expand the Scan Locations collection and hover over some of the location icons to see the display of number of points in the scan.


  3. Expand the View States collection and select some of the view states to see different areas of the point cloud.
  4. Select the Intersection Lanes view.
  5. Change the Point Display to 1.

Task 3: Measure horizontal and vertical distances to check the point cloud scale

  1. Select the freehand distance tool and measure the distance between the lane markers.


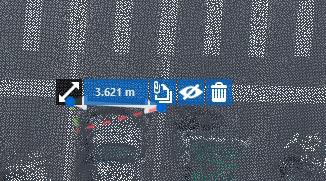
  2. The distance should be around 3.4 to 3.6 meters.
  3. Hover over the dimension text and select the Trash Can symbol to delete the dimension.
  4. Select the Pedestrian Bridge view state.
  5. Use the freehand distance tool again to check the vertical measurement.


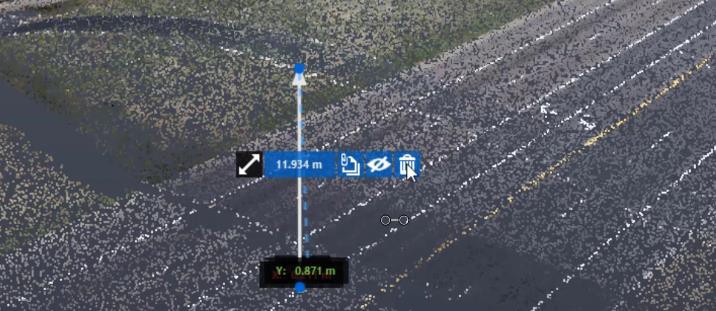
  6. The distance should be around 12 meters.
  7. Hover over the dimension text and select the Trash Can symbol to delete the dimension.
  8. Exit Recap – you do not need to save the Recap project.
Was this information helpful?